
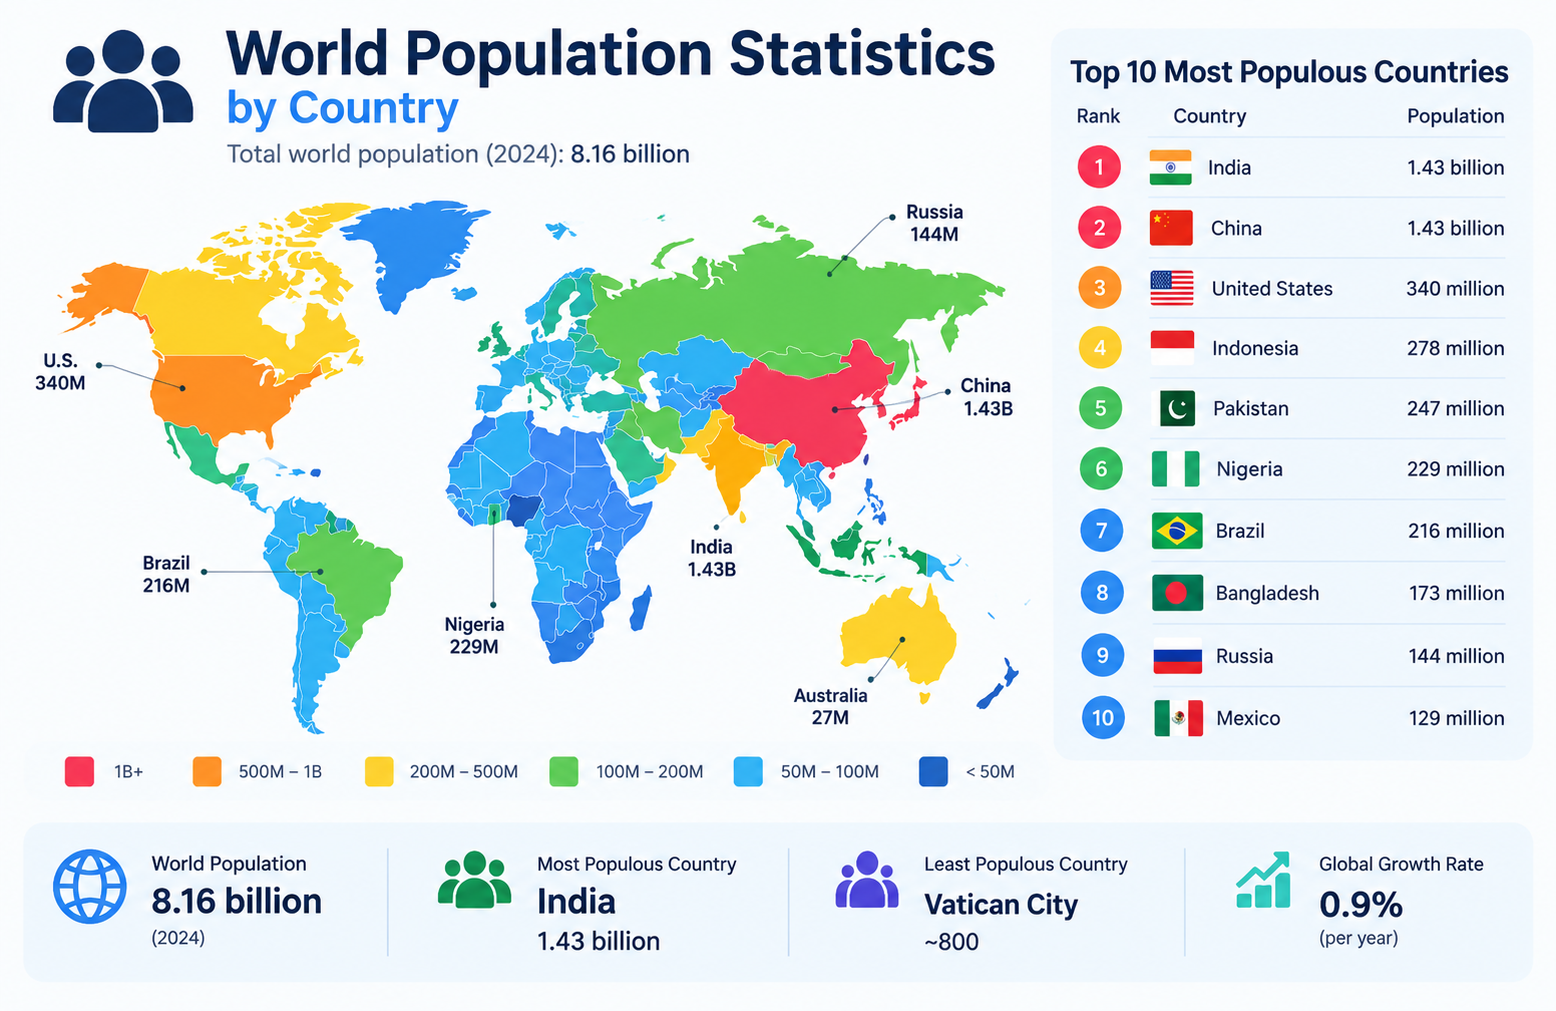
The world crossed 8 billion people in November 2022 — a milestone that took all of human history to reach the first billion in approximately 1804, but only 12 years to add the most recent billion. That acceleration, followed by a now-slowing growth rate of approximately 0.9% per year, is the central statistical story of modern population geography.
This page compiles primary-source world population statistics by country covering rankings, growth rates, density data, demographic trends, and projections — through 2024–2025.
What This Page Covers
✓ World population — current total and historical growth
✓ Top 20 most populous countries (2025 rankings)
✓ Population density statistics by country
✓ Fastest and slowest growing populations
✓ Population by continent — comparison data
✓ Urban vs. rural population split
✓ Age structure and median age statistics
✓ Fertility rate and birth rate data by country
✓ Population projections — 2050 and 2100
✓ Statistical concepts: growth rate, density, geometric mean, standard deviation
Executive Summary: Core Population Benchmarks
| Benchmark | Value | Label |
|---|---|---|
| 🌍 | ~8.2 billion | World Population (2025) |
| 🇮🇳 | ~1.44 billion | Most Populous Country — India (2024) |
| 🏜️ | ~2.2 people/km² | Least Dense Country — Mongolia |
| 📈 | ~0.9% | Current Annual World Growth Rate |
These four figures anchor the statistical landscape of global population. The distribution of those 8.2 billion people across approximately 195 countries is highly unequal — from 800 people in Vatican City to 1.44 billion in India. As explained on the standard deviation page, this extreme spread makes population one of the most statistically variable datasets in geography.
⚠️ Important Disclaimer
All population data on this page is sourced from primary international sources including the United Nations Population Division, World Bank, and U.S. Census Bureau International Database. This page is statistical reference material for educational purposes only — not demographic forecasting or policy advice.
Primary sources: UN Population Division — World Population Prospects 2024; World Bank Open Data; U.S. Census Bureau International Database; Our World in Data; CIA World Factbook 2024.
World Population — Current Total & Historical Growth
The world population is estimated at approximately 8.2 billion as of 2025 [UN Population Division, World Population Prospects 2024]. This figure has grown from approximately 2.5 billion in 1950 — meaning the world added more people in the past 75 years than in all prior recorded human history combined.
The rate of growth has changed substantially. The annual growth rate peaked at approximately 2.1% in 1963 during the post-WWII baby boom and green revolution. It has since fallen to approximately 0.9% in 2024 — still positive, but decelerating. The UN projects it will continue declining toward 0% by the late 21st century.
Table 1: World Population Milestones
| Milestone | Year Reached | Years to Add This Billion | World Context |
|---|---|---|---|
| 1 Billion | ~1804 | All of human history | Pre-industrial; agricultural economies |
| 2 Billion | ~1927 | ~123 years | Industrial Revolution; early medicine |
| 3 Billion | ~1960 | ~33 years | Post-WWII boom; antibiotics |
| 4 Billion | ~1974 | ~14 years | Green Revolution; falling child mortality |
| 5 Billion | ~1987 | ~13 years | Continued development; Cold War era |
| 6 Billion | ~1999 | ~12 years | Globalization; HIV/AIDS; internet age |
| 7 Billion | ~2011 | ~12 years | Economic growth in Asia/Africa |
| 8 Billion | Nov 2022 | ~11 years | Slowing growth; aging populations |
| 9 Billion | ~2037 (projected) | ~15 years (est.) | Growth concentrated in Africa |
Source: United Nations Population Division — World Population Prospects 2024; Our World in Data — Population and Demography.
✅ The pattern reveals both the acceleration phase (1 billion to 8 billion in roughly 200 years) and the emerging deceleration: the time to add the next billion is now projected to lengthen, not shorten, as global fertility rates fall below replacement level in a growing number of countries.
Top 20 Most Populous Countries (2025)
A landmark demographic shift occurred in 2023: India overtook China as the world’s most populous country — the first time China had not held the top position in centuries [UN Population Division]. India’s population continues growing at approximately 0.8% annually, while China’s growth has slowed to near zero and may turn negative.
Table 2: Top 20 Most Populous Countries (2025)
| Rank | Country | Population (Millions, est.) | % of World Population | Region |
|---|---|---|---|---|
| 1 | India | 1,441 | 17.5% | Asia |
| 2 | China | 1,409 | 17.1% | Asia |
| 3 | USA | 341 | 4.1% | North America |
| 4 | Indonesia | 283 | 3.4% | Asia |
| 5 | Pakistan | 251 | 3.1% | Asia |
| 6 | Brazil | 218 | 2.6% | South America |
| 7 | Nigeria | 229 | 2.8% | Africa |
| 8 | Bangladesh | 174 | 2.1% | Asia |
| 9 | Russia | 144 | 1.7% | Europe/Asia |
| 10 | Ethiopia | 132 | 1.6% | Africa |
| 11 | Mexico | 130 | 1.6% | North America |
| 12 | Egypt | 107 | 1.3% | Africa |
| 13 | DR Congo | 106 | 1.3% | Africa |
| 14 | Philippines | 117 | 1.4% | Asia |
| 15 | Tanzania | 67 | 0.8% | Africa |
| 16 | Iran | 90 | 1.1% | Asia |
| 17 | Germany | 84 | 1.0% | Europe |
| 18 | Turkey | 86 | 1.0% | Europe/Asia |
| 19 | Thailand | 72 | 0.9% | Asia |
| 20 | United Kingdom | 68 | 0.8% | Europe |
Source: UN Population Division World Population Prospects 2024; World Bank Population Data 2024.
📊 Key Statistical Observations:
- India + China alone account for approximately 2.85 billion people — roughly 35% of the entire world population — while occupying approximately 7% of global land area
- Africa has 6 countries in the top 20 (Nigeria, Ethiopia, Egypt, DR Congo, Tanzania) — a number projected to increase substantially by 2050
- Asia dominates completely: 10 of the top 20 most populous countries are Asian nations
Least Populous Countries and Territories
At the opposite extreme of the global population distribution sit a group of small island nations and city-states — statistical outliers that illustrate just how wide the distribution of country populations truly is.
Table 3: 10 Least Populous Sovereign States (2025)
| Rank | Country / Territory | Estimated Population | Region | Notes |
|---|---|---|---|---|
| 1 | Vatican City | ~800 | Europe | Smallest sovereign state by population |
| 2 | Nauru | ~10,000 | Oceania | World’s smallest island nation |
| 3 | Tuvalu | ~11,000 | Oceania | Low-lying Pacific atoll; climate risk |
| 4 | Palau | ~18,000 | Oceania | Island archipelago |
| 5 | San Marino | ~34,000 | Europe | Landlocked within Italy |
| 6 | Liechtenstein | ~39,000 | Europe | Doubly landlocked |
| 7 | Monaco | ~40,000 | Europe | Most densely populated despite tiny population |
| 8 | Marshall Islands | ~42,000 | Oceania | Pacific atoll nation |
| 9 | Saint Kitts and Nevis | ~53,000 | Caribbean | Smallest sovereign state in Western Hemisphere |
| 10 | Maldives | ~530,000 | Asia | Sea-level vulnerability |
Source: UN Population Division; CIA World Factbook 2024.
These countries sit at the extreme left tail of the global population distribution. The ratio between the most populous country (India at ~1.44 billion) and the least populous sovereign state (Vatican City at ~800) is approximately 1.8 billion to 1 — an extreme example of positive skew in statistical data.
Population Density Statistics by Country
Population density measures how many people live within each square kilometer of a country’s total area:
Density = Total Population / Land Area (km²)
Density is a more geographically informative statistic than raw population count because it accounts for the physical space available to support that population. A country with 50 million people in 1,000 km² faces fundamentally different resource, housing, and infrastructure challenges than one with 50 million people in 1,000,000 km².
Table 4: Most Densely Populated Countries (2025)
| Rank | Country | Density (people/km²) | Total Population | Land Area (km²) |
|---|---|---|---|---|
| 1 | Monaco | ~26,150 | ~40,000 | ~2 |
| 2 | Singapore | ~8,358 | ~6,000,000 | ~718 |
| 3 | Bahrain | ~2,239 | ~1,500,000 | ~760 |
| 4 | Vatican City | ~2,272 | ~800 | ~0.44 |
| 5 | Maldives | ~1,802 | ~530,000 | ~300 |
| 6 | Bangladesh | ~1,325 | ~174,000,000 | ~147,570 |
| 7 | Palestinian Territories | ~847 | ~5,350,000 | ~6,020 |
| 8 | Taiwan | ~672 | ~23,600,000 | ~36,000 |
| 9 | South Korea | ~527 | ~51,800,000 | ~100,210 |
| 10 | Rwanda | ~525 | ~14,200,000 | ~26,338 |
| 11 | Netherlands | ~512 | ~17,900,000 | ~41,543 |
| 12 | India | ~477 | ~1,441,000,000 | ~3,287,263 |
| 13 | Haiti | ~414 | ~11,400,000 | ~27,750 |
| 14 | Israel | ~411 | ~9,800,000 | ~20,770 |
| 15 | Belgium | ~383 | ~11,700,000 | ~30,528 |
Source: World Bank Population Density Data (SP.POP.DNST); UN Statistics Division.
Table 5: Least Densely Populated Countries (2025)
| Rank | Country | Density (people/km²) | Land Area (km²) | Total Population |
|---|---|---|---|---|
| 1 | Mongolia | ~2.2 | ~1,564,116 | ~3,400,000 |
| 2 | Namibia | ~3.4 | ~824,292 | ~2,800,000 |
| 3 | Australia | ~3.5 | ~7,692,024 | ~26,500,000 |
| 4 | Iceland | ~3.6 | ~103,000 | ~376,000 |
| 5 | Suriname | ~4.0 | ~163,820 | ~650,000 |
| 6 | Botswana | ~4.3 | ~581,730 | ~2,600,000 |
| 7 | Libya | ~4.5 | ~1,759,540 | ~7,200,000 |
| 8 | Canada | ~4.2 | ~9,984,670 | ~40,100,000 |
| 9 | Guyana | ~4.1 | ~214,969 | ~800,000 |
| 10 | Russia | ~9.0 | ~17,098,242 | ~144,000,000 |
Source: World Bank Population Density Data; UN Statistics Division.
The density ratio between Monaco (~26,150 people/km²) and Mongolia (~2.2 people/km²) is approximately 11,886:1 — one of the widest statistical ranges in any geographic dataset. Understanding this spread requires the concept of standard deviation across all countries: the mean global density is approximately 60 people/km², but the standard deviation is enormous. See the standard deviation page for how such extreme variability is measured and interpreted.
Population by Continent — Comparison Data
Table 6: Population by Continent (2025)
| Continent | Population (Billions) | % of World | Area (Million km²) | Avg Density (per km²) | Sovereign Countries |
|---|---|---|---|---|---|
| Asia | ~4.70 | ~57% | ~44.6 | ~105 | ~50 |
| Africa | ~1.48 | ~18% | ~30.4 | ~49 | 54 |
| Europe | ~0.75 | ~9% | ~10.5 | ~73 | ~44 |
| North America | ~0.61 | ~7.4% | ~24.7 | ~25 | ~23 |
| South America | ~0.44 | ~5.4% | ~17.8 | ~25 | 12 |
| Oceania | ~0.046 | ~0.6% | ~9.0 | ~5 | ~14 |
| Antarctica | 0 | 0% | ~14.2 | 0 | 0 (territory) |
| World Total | ~8.20 | 100% | ~149.0 | ~55 | ~195 |
Source: UN Population Division World Population Prospects 2024; World Bank Regional Aggregates 2024.
Asia’s dominance is the defining feature of global population geography: 57% of all humans live on a continent that covers approximately 30% of global land area. Africa, by contrast, holds 18% of world population on 20% of land area — but is the fastest-growing continent and is projected to hold approximately 40% of world population by 2100 [UN medium variant].
Fastest Growing Populations
The Rule of 70 — Population Doubling Time
A useful statistical approximation for understanding population growth is the Rule of 70:
Doubling Time ≈ 70 / Annual Growth Rate (%)
This is mathematically analogous to the Rule of 72 used in compound interest — because population growth, like investment growth, follows the compound formula P(t) = P₀(1 + r)^t. See our Compound Interest Statistics page for the full derivation of this compound growth formula and how it applies across both financial and demographic contexts.
Table 7: Fastest Growing Populations (Annual Rate, 2024)
| Rank | Country | Annual Growth Rate | Current Population (Millions, est.) | Doubling Time (est., years) | Region |
|---|---|---|---|---|---|
| 1 | Niger | ~3.7% | ~27 | ~19 years | Sub-Saharan Africa |
| 2 | Mali | ~2.9% | ~24 | ~24 years | Sub-Saharan Africa |
| 3 | Chad | ~2.9% | ~18 | ~24 years | Sub-Saharan Africa |
| 4 | Angola | ~2.8% | ~36 | ~25 years | Sub-Saharan Africa |
| 5 | DR Congo | ~2.7% | ~106 | ~26 years | Sub-Saharan Africa |
| 6 | Uganda | ~2.7% | ~50 | ~26 years | Sub-Saharan Africa |
| 7 | Somalia | ~2.6% | ~18 | ~27 years | Sub-Saharan Africa |
| 8 | South Sudan | ~2.5% | ~11 | ~28 years | Sub-Saharan Africa |
| 9 | Zambia | ~2.9% | ~20 | ~24 years | Sub-Saharan Africa |
| 10 | Mozambique | ~2.8% | ~34 | ~25 years | Sub-Saharan Africa |
| 11 | Guinea | ~2.6% | ~14 | ~27 years | Sub-Saharan Africa |
| 12 | Burkina Faso | ~2.6% | ~23 | ~27 years | Sub-Saharan Africa |
| 13 | Tanzania | ~2.7% | ~67 | ~26 years | Sub-Saharan Africa |
| 14 | Benin | ~2.7% | ~13 | ~26 years | Sub-Saharan Africa |
| 15 | Cameroon | ~2.5% | ~28 | ~28 years | Sub-Saharan Africa |
Source: UN Population Division World Population Prospects 2024; World Bank Population Growth Annual % Data.
Every country in the top 15 fastest-growing list is in Sub-Saharan Africa — a statistical concentration driven by young age structures (median age ~19 years), high total fertility rates (averaging ~4.5 children per woman), and improving but still high birth rates relative to declining death rates.
Slowest Growing and Declining Populations
Table 8: Slowest Growing or Declining Populations (2024)
| Country | Annual Growth Rate | Current Population (Millions) | Primary Cause | Region |
|---|---|---|---|---|
| South Korea | ~−0.1% | ~51.8 | World’s lowest TFR (~0.72) | East Asia |
| Ukraine | ~−3.7% | ~37.0 | War displacement + low TFR | Europe |
| Bulgaria | ~−0.7% | ~6.5 | Emigration + low fertility | Europe |
| Latvia | ~−0.9% | ~1.8 | Emigration; aging population | Europe |
| Lithuania | ~−1.0% | ~2.8 | Emigration to EU; low TFR | Europe |
| Japan | ~−0.5% | ~123.3 | TFR ~1.21; aging population | East Asia |
| Italy | ~−0.2% | ~58.8 | TFR ~1.20; emigration | Europe |
| Croatia | ~−0.6% | ~3.9 | Emigration; aging | Europe |
| Germany | ~0.0% | ~84.4 | Low TFR offset by immigration | Europe |
| Poland | ~−0.1% | ~37.6 | Emigration + low TFR | Europe |
| China | ~0.0% | ~1,409 | TFR ~1.09; end of one-child policy | East Asia |
| Russia | ~−0.2% | ~144 | Low TFR + war mortality | Europe/Asia |
Source: UN Population Division World Population Prospects 2024; OECD Demographic Outlook 2024.
South Korea’s situation deserves specific statistical attention. With a Total Fertility Rate of approximately 0.72 in 2023 — the lowest ever recorded for any country in modern demographic data [Statistics Korea] — the country is projected to lose approximately 50% of its current population by 2100 if trends persist without significant immigration or policy change.
Population momentum explains why decline takes decades to fully manifest: even when TFR falls below replacement, a country with a large young adult cohort continues producing births for decades — delaying the population peak by 20–40 years after fertility crosses the replacement threshold.
Birth Rate, Death Rate & Natural Increase
Key Definitions
- Birth Rate: Number of live births per 1,000 people per year
- Death Rate: Number of deaths per 1,000 people per year
- Natural Increase Rate: The population growth rate from births and deaths alone (excluding migration)
Natural Increase Rate Formula:
NIR = (Birth Rate − Death Rate) / 10
(This converts from per 1,000 to a percentage)
Table 9: Birth Rate vs. Death Rate by Region (2024)
| Region | Birth Rate (per 1,000) | Death Rate (per 1,000) | Natural Increase Rate (%) | Net Migration Rate | Overall Growth Rate |
|---|---|---|---|---|---|
| Sub-Saharan Africa | ~36 | ~9 | ~2.7% | ~−0.2% | ~2.5% |
| South Asia | ~19 | ~7 | ~1.2% | ~−0.1% | ~1.1% |
| East Asia | ~9 | ~8 | ~0.1% | ~0.0% | ~0.1% |
| Latin America | ~15 | ~7 | ~0.8% | ~−0.1% | ~0.7% |
| Middle East & N. Africa | ~21 | ~5 | ~1.6% | ~0.0% | ~1.5% |
| North America | ~11 | ~9 | ~0.2% | ~+0.4% | ~0.6% |
| Europe | ~9 | ~11 | ~−0.2% | ~+0.3% | ~0.1% |
Source: UN Population Division World Population Prospects 2024; World Bank Health Nutrition and Population Data.
The 4:1 ratio between Sub-Saharan Africa’s birth rate (~36 per 1,000) and Europe’s (~9 per 1,000) is the primary statistical driver of diverging demographic trajectories. Europe’s death rate now exceeds its birth rate in the aggregate, making natural population decrease the baseline condition for the continent as a whole.
Fertility Rate Statistics by Country
The Total Fertility Rate (TFR) is defined as the average number of children a woman would have over her lifetime if current age-specific fertility rates remained constant. It is the most widely used single-number summary of a country’s reproductive behavior.
Replacement level TFR = 2.1 children per woman
Below 2.1, a population will eventually shrink without immigration. Above 2.1, it will grow. The world average TFR has fallen from approximately 5.0 in 1950 to approximately 2.3 in 2024 — still above replacement but declining rapidly.
Table 10: Fertility Rate Extremes by Country (2024)
| Category | Country | TFR | Region | Trend |
|---|---|---|---|---|
| Highest | Niger | ~6.8 | Sub-Saharan Africa | Slowly declining |
| Mali | ~5.9 | Sub-Saharan Africa | Slowly declining | |
| Chad | ~5.7 | Sub-Saharan Africa | Slowly declining | |
| Somalia | ~5.7 | Sub-Saharan Africa | Slowly declining | |
| Angola | ~5.4 | Sub-Saharan Africa | Declining | |
| DR Congo | ~5.9 | Sub-Saharan Africa | Slowly declining | |
| Burkina Faso | ~5.1 | Sub-Saharan Africa | Declining | |
| Guinea | ~5.0 | Sub-Saharan Africa | Declining | |
| Uganda | ~4.7 | Sub-Saharan Africa | Declining | |
| Tanzania | ~4.6 | Sub-Saharan Africa | Declining | |
| World Average | — | ~2.3 | — | Declining |
| Replacement Level | — | 2.1 | — | Threshold |
| Lowest | South Korea | ~0.72 | East Asia | Declining further |
| Hong Kong | ~0.77 | East Asia | Declining | |
| Singapore | ~1.04 | East Asia | Slowly declining | |
| Macau | ~1.08 | East Asia | Stable/low | |
| China | ~1.09 | East Asia | Declining | |
| Spain | ~1.16 | Europe | Stable/low | |
| Italy | ~1.20 | Europe | Stable/low | |
| Japan | ~1.21 | East Asia | Declining | |
| Greece | ~1.35 | Europe | Slowly recovering | |
| Portugal | ~1.40 | Europe | Stable/low |
Source: UN Population Division World Population Prospects 2024; World Bank Fertility Rate Data (SP.DYN.TFRT.IN).
Countries with TFR below 2.1 will, without immigration, face eventual population decline. This has significant implications for pension system sustainability, labor force size, and economic growth — topics covered in our Personal Finance Statistics page in the context of aging population economics.
Age Structure — Median Age by Country
Median age is the age that divides a population exactly in half — half the population is younger, half is older. It is a more informative summary statistic than mean age for skewed age distributions, because it is not distorted by extreme values.
The global median age is approximately 30.9 years [UN Population Division, 2024].
Table 11: Median Age by Country — Extremes (2024)
| Category | Country | Median Age (Years) | Region | Economic Implication |
|---|---|---|---|---|
| Oldest | Monaco | ~55.4 | Europe | Very high pension burden; high GDP per capita |
| Japan | ~49.5 | East Asia | Labor shortage; robotic investment; pension strain | |
| Italy | ~48.7 | Europe | High elderly dependency ratio | |
| Germany | ~46.8 | Europe | Labor imports; fiscal pressure | |
| Finland | ~43.1 | Europe | Welfare system under demographic pressure | |
| Spain | ~44.9 | Europe | Youth unemployment; elderly care costs | |
| World Average | — | ~30.9 | — | — |
| Youngest | Niger | ~15.1 | Sub-Saharan Africa | Very large youth dependency; high future growth |
| Mali | ~15.8 | Sub-Saharan Africa | Youth bulge; education pressure | |
| Chad | ~15.8 | Sub-Saharan Africa | High young dependency ratio | |
| Uganda | ~16.0 | Sub-Saharan Africa | Youth dividend potential if employment created | |
| Burkina Faso | ~17.1 | Sub-Saharan Africa | Large working-age cohort emerging | |
| Angola | ~16.9 | Sub-Saharan Africa | Rapid urbanization underway |
Source: UN Population Division World Population Prospects 2024; CIA World Factbook 2024.
The 34-year gap between Monaco’s median age (~55.4) and Niger’s (~15.1) represents perhaps the widest demographic contrast on Earth. Countries with young median ages have large potential youth dividends — rapid economic growth when young cohorts enter the labor force — but only if employment opportunities, education, and infrastructure can absorb them.
Urban vs. Rural Population Split
For the first time in history, more than 50% of the world’s population lived in urban areas in 2007 [UN World Urbanization Prospects]. By 2024, that figure has risen to approximately 57%, and the UN projects it will reach approximately 68% by 2050.
Table 12: Urban Population Percentage by Region (2024)
| Region | Urban % | Rural % | Urban Population (Millions, est.) | Trend |
|---|---|---|---|---|
| North America | ~83% | ~17% | ~310 | Stable; slow growth |
| Latin America | ~82% | ~18% | ~545 | High; some reversal post-COVID |
| Europe | ~75% | ~25% | ~565 | Stable; aging cities |
| East Asia | ~67% | ~33% | ~1,350 | Rapid; China urbanization continuing |
| Middle East & N. Africa | ~66% | ~34% | ~340 | Fast growth in Gulf cities |
| Oceania | ~68% | ~32% | ~31 | Stable; concentrated in Australia/NZ |
| South Asia | ~37% | ~63% | ~730 | Rapid; India urbanization accelerating |
| Sub-Saharan Africa | ~43% | ~57% | ~640 | Fastest urbanizing region globally |
| World Average | ~57% | ~43% | ~4,680 | Rising ~1% per year |
Source: UN World Urbanization Prospects 2024; World Bank Urban Development Indicators.
Sub-Saharan Africa deserves particular note: while only 43% urban today — the lowest of any major region — it is simultaneously the fastest urbanizing region globally. African cities are projected to absorb approximately 1 billion additional urban residents between 2025 and 2050 [UN World Urbanization Prospects 2024].
Population Projections — 2050 and 2100
All projections below reflect the UN medium variant — the central estimate from the World Population Prospects 2024. High and low variants diverge substantially by 2100. These are statistical projections built on current trend assumptions, not deterministic forecasts.
Table 13: World Population Projections — UN Medium Variant
| Year | Projected Population | Change from 2025 | Annual Growth Rate | Key Driver |
|---|---|---|---|---|
| 2025 | ~8.20B | — | ~0.9% | Africa + South Asia growth |
| 2030 | ~8.55B | +350M | ~0.8% | Africa dominant contributor |
| 2040 | ~9.08B | +880M | ~0.7% | Fertility decline accelerating |
| 2050 | ~9.70B | +1.50B | ~0.5% | Africa remains primary driver |
| 2060 | ~10.15B | +1.95B | ~0.4% | Growth slowing significantly |
| 2075 | ~10.38B | +2.18B | ~0.1% | Near-peak; East Asia declining |
| 2100 | ~10.43B | +2.23B | ~0.1% | Plateau; Africa + South Asia |
Source: UN Population Division — World Population Prospects 2024, Medium Variant.
Table 14: Most Populous Countries in 2050 (Projected — UN Medium Variant)
| Projected Rank | Country | 2050 Population (Projected) | 2025 Population (est.) | Change | Region |
|---|---|---|---|---|---|
| 1 | India | ~1.67B | ~1.44B | +~230M | Asia |
| 2 | China | ~1.32B | ~1.41B | −~90M | Asia |
| 3 | Nigeria | ~0.54B | ~0.23B | +~310M | Africa |
| 4 | Pakistan | ~0.49B | ~0.25B | +~240M | Asia |
| 5 | USA | ~0.38B | ~0.34B | +~40M | North America |
| 6 | DR Congo | ~0.38B | ~0.11B | +~270M | Africa |
| 7 | Ethiopia | ~0.26B | ~0.13B | +~130M | Africa |
| 8 | Indonesia | ~0.30B | ~0.28B | +~20M | Asia |
| 9 | Tanzania | ~0.23B | ~0.07B | +~160M | Africa |
| 10 | Brazil | ~0.23B | ~0.22B | +~10M | South America |
Source: UN Population Division World Population Prospects 2024 — Medium Variant Projections.
The most significant projected shift: Nigeria is expected to rise from 7th to 3rd most populous by 2050, surpassing the United States. Africa will have 7 of the top 15 most populous countries in 2050, compared to 6 today. The UN projects world population to peak at approximately 10.4 billion around 2080–2100, then plateau or begin a slow decline as global fertility converges toward and below replacement level.
Population Mathematics — Worked Statistical Examples
Population growth is governed by the same compound growth formula that applies to investment returns and price levels. Understanding the mathematics makes demographic data statistically interpretable rather than just a collection of numbers.
The Compound Population Growth Formula
P(t) = P₀ × (1 + r)^t
Where:
- P(t) = Population at time t
- P₀ = Starting population
- r = Annual growth rate (expressed as a decimal)
- t = Number of years
This is mathematically identical to the investment compound growth formula covered on our Compound Interest Statistics page — the variable r represents annual growth rate in both contexts, whether measuring investment return or population change.
Worked Example 1: India’s Population Growth (2000–2024)
Known values:
- P₀ = 1.00 billion (year 2000)
- r = 1.4% = 0.014 (approximate average annual rate)
- t = 24 years
Step 1 — Apply the formula:
P(24) = 1.00B × (1.014)^24
Step 2 — Calculate (1.014)^24:
(1.014)^24 = e^(24 × ln(1.014)) = e^(24 × 0.01390) = e^(0.3336) ≈ 1.396
Step 3 — Final result:
P(24) = 1.00B × 1.396 = ~1.396 billion
Actual 2024 figure: ~1.44 billion [UN WPP 2024]
The small difference (1.396B calculated vs. 1.44B actual) reflects that India’s growth rate was slightly higher than 1.4% in the early 2000s and has since slowed — illustrating why a constant-rate model approximates but does not perfectly replicate real demographic trajectories.
Worked Example 2: Niger’s Population Doubling Time
Given:
- Niger annual growth rate: approximately 3.7%
- Current population: approximately 27 million
Step 1 — Apply the Rule of 70:
Doubling Time ≈ 70 / 3.7 ≈ 18.9 years
Step 2 — Verify with compound formula:
P(19) = 27M × (1.037)^19 = 27M × 2.00 = ~54 million
Interpretation: At current growth rates, Niger’s population would double to approximately 54 million in roughly 19 years — reaching that level by approximately 2043.
Step 3 — Project to 2100:
P(76) = 27M × (1.037)^76 ≈ 27M × 15.7 ≈ ~424 million
This projection illustrates why demographic momentum matters statistically: even if Niger’s fertility rate falls substantially over the coming decades, the large young cohort currently alive will produce births for decades. The geometric mean growth rate over any multi-year period uses the same formula as investment CAGR.
Population Growth Calculator
LearnMinto Population Growth Calculator
This calculator applies the standard compound population growth formula to model how any starting population changes over time at a given annual growth rate.
Formula Applied: P(t) = P₀ × (1 + r)^t
Inputs:
- Starting Population: __________
- Annual Growth Rate (%): __________
- Time Horizon (Years): __________
- Country Comparison: [Optional dropdown — pre-loaded with UN 2024 data]
Outputs:
- Projected population after t years
- Doubling time estimate (Rule of 70)
- Year when population reaches a user-defined target
- Growth as a multiple of starting population
- Year-by-year growth table (expandable)
5 Key Insights From World Population Data
Insight 1 — Asia’s Statistical Dominance
Asia holds approximately 4.7 billion people — 57% of all humans on Earth — while India and China alone account for approximately 35% of world population. No other continent approaches this concentration. Asia’s demographic weight means that fertility trends in India, China, Indonesia, and Pakistan alone significantly influence the global growth rate trajectory.
Insight 2 — Africa’s Demographic Momentum
Africa is the fastest-growing continent with a current growth rate of approximately 2.4% per year. It holds 18% of world population today and is projected to hold approximately 40% by 2100 under the UN medium variant. The continent’s median age of approximately 19 years — compared to Europe’s ~43 years — means a large working-age cohort is just entering its peak reproductive years. This demographic momentum will sustain high growth rates for decades regardless of near-term fertility changes.
Insight 3 — The Global Fertility Transition
World TFR has fallen from approximately 5.0 children per woman in 1950 to approximately 2.3 in 2024 — a reduction of more than 50% in one lifetime. More than 50% of countries now have fertility rates below replacement level (2.1). This transition, if it continues, will cause world population to plateau and eventually decline — though the timing remains statistically uncertain and dependent on fertility trends in Sub-Saharan Africa.
Insight 4 — The Urbanization Shift
The world crossed 50% urban for the first time in 2007 [UN World Urbanization Prospects]. By 2025, approximately 57% of the global population lives in cities. By 2050, that figure is projected to reach approximately 68% — meaning an additional 2.5 billion urban residents will need housing, infrastructure, water, energy, and employment within the next 25 years. Most of that growth will occur in African and Asian cities.
Insight 5 — Rapid Population Aging
In 2019, approximately 1 in 11 people globally was aged 65 or older. By 2050, that ratio is projected to reach 1 in 6 — approximately 1.6 billion elderly people [UN Population Division, 2024]. This demographic shift has profound implications for public pension systems, healthcare spending, and labor markets.
The economic consequences of aging populations are analyzed in detail on our Personal Finance Statistics page.
Frequently Asked Questions
Q1: What is the current world population in 2025?
The estimated world population as of 2025 is approximately 8.2 billion people [UN Population Division, World Population Prospects 2024]. This figure increases by approximately 75–80 million people per year — roughly the population of Germany — driven primarily by high birth rates in Sub-Saharan Africa and South Asia. The world population crossed 8 billion in November 2022, and the UN’s medium variant projection places the next milestone of 9 billion around 2037.
Q2: Which country has the highest population?
India became the world’s most populous country in 2023, overtaking China for the first time in recorded modern demographic history [UN Population Division]. India’s estimated population is approximately 1.44 billion as of 2024, with an annual growth rate of approximately 0.8%. China’s population has begun to decline, with a 2024 estimate of approximately 1.41 billion and a slightly negative natural increase rate.
Q3: Which country is the most densely populated?
Monaco is the most densely populated sovereign state in the world, with approximately 26,150 people per km² — the result of approximately 40,000 residents concentrated in just 2 km² of land area [World Bank Population Density Data]. Among large countries, Bangladesh is the most densely populated at approximately 1,325 people per km², despite having a land area of nearly 148,000 km².
Q4: What is the world’s population growth rate?
The current annual world population growth rate is approximately 0.9% [UN WPP 2024] — down from a peak of approximately 2.1% in 1963. This deceleration reflects falling fertility rates in Asia, Latin America, and increasingly in Africa. At 0.9%, the world adds approximately 75–80 million people per year. Using the Rule of 70 (doubling time ≈ 70 / growth rate), the current rate implies a population doubling time of approximately 78 years — though actual doubling will not occur as fertility continues to fall.
Q5: When will world population peak?
Under the UN medium variant projection, world population is expected to reach approximately 10.4 billion around 2080–2100 and then plateau or begin a gradual decline [UN WPP 2024]. The IHME’s alternative model projects an earlier and lower peak — approximately 9.7 billion around 2064 — followed by a more rapid decline. The difference between models reflects statistical uncertainty about fertility trends in Sub-Saharan Africa. These are projections with wide confidence bands, not deterministic forecasts.
Q6: What country has the lowest fertility rate?
South Korea recorded the world’s lowest Total Fertility Rate of approximately 0.72 in 2023 [Statistics Korea; UN WPP 2024] — a figure approximately one-third of the replacement level of 2.1. This means South Korean women are on average having fewer than 1 child over their lifetime. Hong Kong (~0.77) and Singapore (~1.04) also rank among the lowest globally. South Korea’s government has spent approximately $200 billion over two decades on pro-natalist policies with limited statistical impact on fertility behavior.
Key Terms Glossary
Population Density
The number of people per unit of land area, calculated as total population divided by total land area in km². It is the primary measure for comparing how crowded different countries or regions are relative to their available physical space.
Total Fertility Rate (TFR)
The average number of children a woman would have over her lifetime if current age-specific fertility rates remained constant throughout her reproductive years (typically ages 15–49). A TFR of 2.1 represents replacement-level fertility — the rate at which a population replaces itself without net migration.
Natural Increase Rate
The percentage rate of population growth resulting from births minus deaths alone, excluding the effect of migration. Calculated as (Birth Rate − Death Rate) / 10, converting from per-1,000 to a percentage.
Population Growth Rate
The overall percentage rate at which a population changes in a given year, including both natural increase (births minus deaths) and net migration (immigrants minus emigrants). It is the compound rate used in the formula P(t) = P₀(1 + r)^t.
Doubling Time
The number of years it would take a population to double in size at a constant growth rate. Estimated using the Rule of 70: Doubling Time ≈ 70 / Annual Growth Rate (%). At 3.7% growth, doubling time is approximately 19 years.
Age Dependency Ratio
The ratio of dependent population (children under 15 and elderly over 64) to the working-age population (15–64), expressed as a percentage. A high ratio indicates a large burden on the working-age population to support dependents through taxation and social services.
Urbanization Rate
The percentage of a country’s total population living in urban areas, plus the annual rate at which that percentage is increasing. Countries with high urbanization rates tend to have higher GDP per capita but also face urban infrastructure and inequality challenges.
Demographic Transition
A model describing the shift from high birth rates and high death rates (pre-industrial societies) to low birth rates and low death rates (post-industrial societies), typically passing through a period of rapid population growth in between. Most developed countries have completed the transition; Sub-Saharan Africa is mid-transition.
Population Momentum
The tendency for population growth to continue even after fertility falls to replacement level, because of the large number of young people already born who have yet to reach their reproductive years. It typically takes 50–70 years for a population to stabilize after TFR reaches 2.1.
Median Age
The age that divides a population exactly in half, with equal numbers of people above and below that age. It is a more representative summary than mean age for skewed age distributions, and is used to assess a country’s stage of demographic transition and economic development.
Statistical Concepts Used On This Page
Compound Growth Formula: Population growth uses P(t) = P₀(1 + r)^t — identical to the investment compound growth formula. See the Compound Interest Statistics page for the full derivation, worked examples, and the relationship between growth rate, time, and terminal value.
Geometric Mean: Average annual population growth rates across multiple years must be computed as geometric means — not arithmetic means — because growth compounds annually.
Standard Deviation: Country populations range from ~800 (Vatican City) to ~1.44 billion (India) — an extreme distribution with very high standard deviation. The mean population per country (~40 million) vastly overstates the typical country’s size.
Median vs. Mean: The world average population per country (~40 million) far exceeds the median country population (~5–6 million) because a small number of extremely populous countries pull the arithmetic mean upward. This is positive skew in action.
Normal Distribution: Country populations are not normally distributed — they follow an extremely right-skewed distribution with a long tail toward high values (India, China) and a compressed left tail.
Rate of Change and Percentage Change: Population growth rate is a standard percentage rate of change calculation — the same mathematical operation used in inflation statistics and investment return analysis.
Related Articles on LearnMinto
- Compound Interest Statistics: The compound growth formula P(t) = P₀(1+r)^t used throughout this page is derived and explained in full. See how the same mathematics governs both population growth and investment accumulation.
- Personal Finance Statistics: Economic implications of aging populations, retirement savings gaps, and the fiscal stress produced by rising age dependency ratios.
- Inflation Statistics: How population growth affects aggregate demand and price levels — the demographic dimension of macroeconomic inflation analysis.
- GDP Statistics: How population size and growth rate interact with economic output per capita — the fundamental relationship between demography and economic development.
- Unemployment Statistics: How demographic structure (age distribution, youth bulge, aging) shapes labor market supply, unemployment rates, and wage growth.
- Net Worth Statistics: How population aging and demographic transition affect wealth accumulation patterns at the household level.
Further Reading & Data Sources
United Nations Population Division — World Population Prospects 2024 (population.un.org)
The definitive global demographic database, updated biennially. Source for all country-level population estimates, fertility rates, life expectancy, age structure, and long-run projections in this article. Freely downloadable as CSV or Excel.
World Bank Open Data — Population (data.worldbank.org)
Comprehensive country-level population, density, fertility, birth rate, death rate, and urbanization data with consistent long-run methodology. Used for cross-country comparison tables throughout this page.
U.S. Census Bureau — International Database (census.gov/international)
Country-by-country population estimates and projections maintained by the U.S. government. Particularly useful for regional and sub-national demographic breakdowns.
Our World in Data — Population and Demography (ourworldindata.org/population)
Long-run historical population data from 10,000 BCE to present, with interactive visualizations. Particularly valuable for the population milestones data in Table 1 and historical context.
CIA World Factbook (cia.gov/the-world-factbook)
Country-level demographic profiles including median age, fertility rate, birth rate, death rate, and net migration. Updated annually. Used for median age data in Table 11.
IHME — Global Burden of Disease Study / Population Forecasts (healthdata.org)
Alternative long-run population projections using different modeling assumptions than UN. Particularly useful for understanding projection uncertainty — the IHME projects an earlier population peak than the UN medium variant.
References
- United Nations Population Division — World Population Prospects 2024
- World Bank Open Data — Population
- U.S. Census Bureau — International Database
- Our World in Data — Population and Demography
- CIA World Factbook — Country Demographics
- IHME — Global Burden of Disease Population Projections
- UN World Urbanization Prospects 2024
- Statistics Korea — Fertility Rate Data
Disclaimer:
This article is intended for educational and informational purposes only. While LearnMinto strives to provide accurate and up-to-date population statistics, readers should verify important data through official sources including the United Nations Population Division, World Bank, and national statistical agencies before using this content for academic, policy, or research purposes. Population projections are estimates based on current trends and carry inherent uncertainty. LearnMinto is not affiliated with any government agency, research institution, or international organization.