
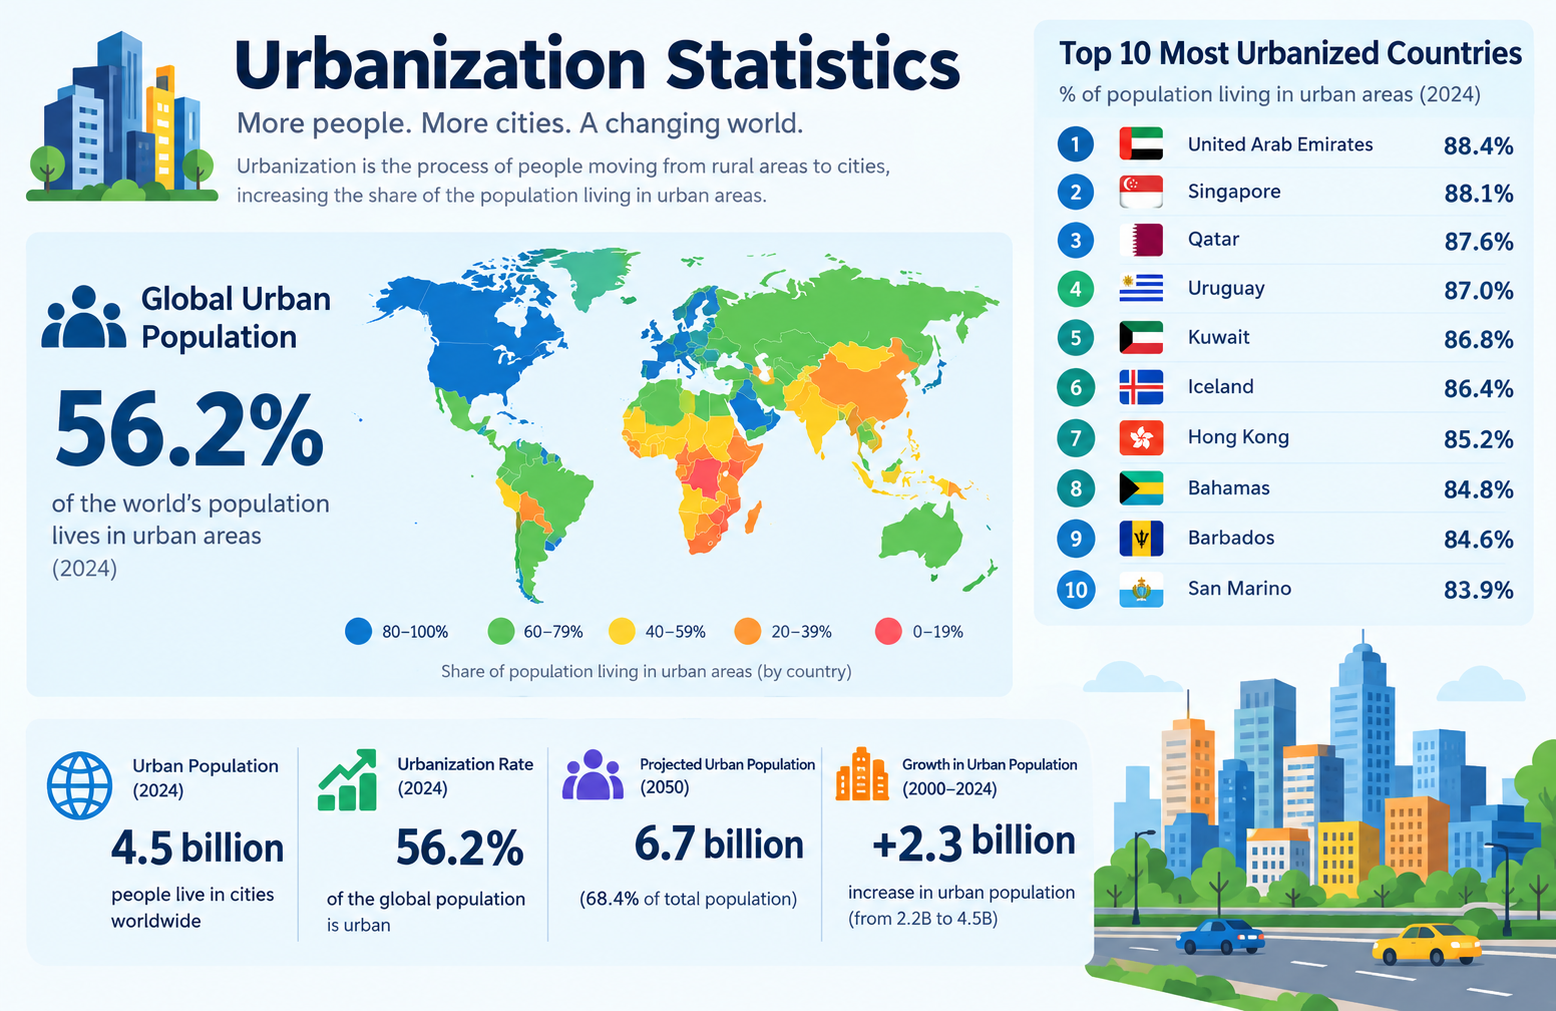
In 2007, for the first time in all of human history, more people lived in cities than in rural areas — a threshold that took millennia to cross and only decades to become a permanent feature of human settlement. By 2025, approximately 57% of all humans on Earth live in urban areas, and that share grows by roughly 1 percentage point every two years.
This page compiles primary-source urbanization statistics covering the global urban population, growth rates by region, the world’s largest cities, megacity data, urban-rural comparisons, and projections through 2050 — all through 2024–2025.
What This Page Covers
✓ Global urban population — current total and growth
✓ Urban population percentage by country and region
✓ Urban vs. rural population — historical comparison
✓ World’s largest cities and megacity statistics
✓ Fastest urbanizing countries and regions
✓ Slum and informal settlement statistics
✓ Economic impact of urbanization
✓ Urban population projections — 2030, 2050
✓ Interactive urbanization calculator
✓ Statistical concepts: growth rate, geometric mean, percentage change, standard deviation
Executive Summary: Core Urbanization Benchmarks
| Benchmark | Value | Label |
|---|---|---|
| 🌆 | ~4.7 billion (57%) | Global Urban Population (2025) |
| 🌎 | ~83% | Most Urbanized Region — North America |
| 🏙️ | ~37 million | Largest City — Tokyo |
| 📈 | ~6.7 billion (68%) | Projected Urban Population by 2050 |
These four figures define the current state and near-term trajectory of global urbanization. The shift from a predominantly rural to a predominantly urban world has occurred within a single lifetime — and is far from complete, particularly in Sub-Saharan Africa and South Asia.
⚠️ Important Disclaimer
All urbanization data on this page is sourced from primary international sources including the United Nations World Urbanization Prospects, World Bank, and UN-Habitat. This page is statistical reference material for educational purposes only — not urban planning or policy advice.
Primary sources: UN World Urbanization Prospects 2024; World Bank Urban Development Indicators; UN-Habitat World Cities Report 2022; Our World in Data — Urbanization.
Global Urban Population — Current Total and Growth
Urbanization is the process by which an increasing proportion of a population comes to live in urban areas — cities and towns — as opposed to rural areas. It is driven by two forces: rural-urban migration (people moving from the countryside to cities) and natural increase (births exceeding deaths within urban areas themselves).
The global urban population stands at approximately 4.7 billion people in 2025, representing 57% of the world’s total population of approximately 8.2 billion [UN World Urbanization Prospects 2024]. Urban areas are growing at approximately 2% per year — more than twice the overall world population growth rate of approximately 0.9% per year.
Table 1: Global Urban Population — Key Milestones
| Year | Urban Population | Urban % | Rural Population | Rural % | World Total | Note |
|---|---|---|---|---|---|---|
| 1950 | ~0.75B | 30% | ~1.77B | 70% | ~2.52B | Post-WWII baseline |
| 1970 | ~1.35B | 37% | ~2.30B | 63% | ~3.65B | Rapid industrialization |
| 1990 | ~2.28B | 43% | ~3.01B | 57% | ~5.29B | Asia urbanization accelerates |
| 2007 | ~3.30B | 50% | ~3.30B | 50% | ~6.60B | Historic crossover point |
| 2010 | ~3.49B | 51.7% | ~3.26B | 48.3% | ~6.75B | Urban majority confirmed |
| 2020 | ~4.38B | 56.2% | ~3.41B | 43.8% | ~7.79B | COVID urban stress test |
| 2025 | ~4.70B | ~57% | ~3.50B | ~43% | ~8.20B | Current estimate |
| 2030 (proj.) | ~5.20B | ~60% | ~3.47B | ~40% | ~8.67B | UN medium variant |
| 2050 (proj.) | ~6.68B | ~68% | ~3.14B | ~32% | ~9.82B | UN medium variant |
Source: UN World Urbanization Prospects 2024; World Bank Urban Development Indicators.
The shift from 30% urban in 1950 to 57% urban in 2025 represents a 27 percentage point change in 75 years — one of the most significant demographic transformations in recorded human history. Equally notable is what the projections show: by 2050, the rural population is expected to begin an absolute decline, not just a proportional one, as urban migration outpaces rural natural increase.
Urban Population by Region (2024)
Regional urbanization rates vary dramatically. North America and Latin America are already highly urbanized; Sub-Saharan Africa and South Asia remain predominantly rural but are urbanizing faster than any other regions.
Table 2: Urban Population Percentage by Region (2024)
| Region | Urban Pop. (Millions) | Urban % | Rural % | Annual Urbanization Rate | Projected Urban % (2050) |
|---|---|---|---|---|---|
| North America | ~310 | ~83% | ~17% | ~0.8% | ~89% |
| Latin America & Caribbean | ~545 | ~82% | ~18% | ~1.0% | ~88% |
| Europe | ~565 | ~75% | ~25% | ~0.4% | ~83% |
| East Asia & Pacific | ~1,350 | ~67% | ~33% | ~1.5% | ~77% |
| Middle East & N. Africa | ~340 | ~66% | ~34% | ~1.8% | ~76% |
| Oceania | ~31 | ~68% | ~32% | ~1.1% | ~73% |
| South Asia | ~730 | ~37% | ~63% | ~2.4% | ~56% |
| Sub-Saharan Africa | ~640 | ~43% | ~57% | ~3.6% | ~61% |
| World Average | ~4,700 | ~57% | ~43% | ~2.0% | ~68% |
Source: UN World Urbanization Prospects 2024; World Bank Urban Population Data.
📊 The most statistically striking contrast is between North America (~83% urban) and Sub-Saharan Africa (~43% urban) — a 40 percentage point gap driven by industrialization timing, income levels, and agricultural employment patterns. Sub-Saharan Africa occupies a dual statistical position: it is simultaneously the least urbanized and fastest urbanizing major region globally, with an annual urbanization rate of approximately 3.6% — nearly 4.5 times the European rate.
South Asia deserves specific attention for projections: while its current urban percentage (~37%) is below the world average, it will see the largest absolute increase in urban residents between 2025 and 2050, driven primarily by India’s ongoing urbanization.
Urban Population by Country — Top and Bottom Rankings
Table 3: Most Urbanized Countries (Urban %, 2024)
| Rank | Country | Urban % | Urban Population | Total Population | Region |
|---|---|---|---|---|---|
| 1 | Kuwait | ~100% | ~4.9M | ~4.9M | Middle East |
| 2 | Singapore | ~100% | ~6.0M | ~6.0M | East Asia |
| 3 | Qatar | ~99% | ~2.9M | ~2.9M | Middle East |
| 4 | Belgium | ~98% | ~11.4M | ~11.7M | Europe |
| 5 | Malta | ~95% | ~0.48M | ~0.53M | Europe |
| 6 | Iceland | ~94% | ~0.35M | ~0.38M | Europe |
| 7 | Uruguay | ~95% | ~3.4M | ~3.5M | Latin America |
| 8 | Luxembourg | ~92% | ~0.58M | ~0.65M | Europe |
| 9 | Israel | ~93% | ~9.1M | ~9.8M | Middle East |
| 10 | Japan | ~92% | ~113M | ~123M | East Asia |
| 11 | Argentina | ~92% | ~41M | ~45M | Latin America |
| 12 | South Korea | ~81% | ~42M | ~52M | East Asia |
| 13 | Australia | ~86% | ~22M | ~26M | Oceania |
| 14 | United States | ~83% | ~282M | ~341M | North America |
| 15 | Brazil | ~88% | ~191M | ~218M | Latin America |
Source: World Bank Urban Population Percentage Data (SP.URB.TOTL.IN.ZS); UN World Urbanization Prospects 2024.
Table 4: Least Urbanized Countries (Urban %, 2024)
| Rank | Country | Urban % | Rural Population | Total Population | Region |
|---|---|---|---|---|---|
| 1 | Papua New Guinea | ~13% | ~9.4M | ~10.3M | Oceania |
| 2 | Burundi | ~14% | ~12.9M | ~13.0M | Sub-Saharan Africa |
| 3 | Niger | ~17% | ~23.0M | ~27.2M | Sub-Saharan Africa |
| 4 | Malawi | ~18% | ~20.0M | ~21.5M | Sub-Saharan Africa |
| 5 | Rwanda | ~18% | ~11.6M | ~14.2M | Sub-Saharan Africa |
| 6 | Ethiopia | ~23% | ~101M | ~132M | Sub-Saharan Africa |
| 7 | South Sudan | ~21% | ~8.8M | ~11.4M | Sub-Saharan Africa |
| 8 | Uganda | ~27% | ~36M | ~50M | Sub-Saharan Africa |
| 9 | Cambodia | ~25% | ~11.3M | ~16.7M | Southeast Asia |
| 10 | Chad | ~24% | ~13.5M | ~18.2M | Sub-Saharan Africa |
Source: World Bank Urban Population Percentage Data; UN World Urbanization Prospects 2024.
The range of urban percentages across countries — from approximately 13% (Papua New Guinea) to 100% (Kuwait, Singapore) — represents an extraordinarily wide statistical distribution. The standard deviation of urban percentage across all countries exceeds 30 percentage points, making urbanization one of the most variable single-indicator datasets in global development statistics.
Historical Urban vs. Rural Comparison
To understand current urbanization statistics properly, the 200-year historical context is essential.
Table 5: Urban vs. Rural Population Split — 1800 to 2050
| Year | Urban Pop. (Billions) | Urban % | Rural Pop. (Billions) | Rural % | Crossover / Note |
|---|---|---|---|---|---|
| 1800 | ~0.03B | ~3% | ~0.88B | ~97% | Pre-industrial; agricultural societies |
| 1900 | ~0.20B | ~14% | ~1.40B | ~86% | Early industrialization; factory cities |
| 1950 | ~0.75B | ~30% | ~1.77B | ~70% | Post-WWII; development programs begin |
| 1975 | ~1.54B | ~38% | ~2.51B | ~62% | Asian manufacturing urbanization |
| 2000 | ~2.84B | ~47% | ~3.22B | ~53% | Approaching crossover point |
| 2007 | ~3.30B | 50% | ~3.30B | 50% | Historic 50/50 crossover |
| 2010 | ~3.49B | ~52% | ~3.26B | ~48% | Urban majority confirmed |
| 2020 | ~4.38B | ~56% | ~3.41B | ~44% | COVID period |
| 2025 | ~4.70B | ~57% | ~3.50B | ~43% | Current |
| 2050 (proj.) | ~6.68B | ~68% | ~3.14B | ~32% | Rural pop. begins absolute decline |
Source: Our World in Data — Urbanization (1800–2024); UN World Urbanization Prospects 2024 (Medium Variant for projections).
The jump from 3% urban in 1800 to 57% urban in 2025 encapsulates the entire arc of industrial and post-industrial economic development. The key observation for 2050 is that the rural population itself is projected to begin declining in absolute terms — not just as a percentage — as the total rural population falls from approximately 3.50 billion in 2025 to approximately 3.14 billion by 2050 [UN WPP 2024, Medium Variant].
World’s Largest Cities — Megacity Statistics
A megacity is defined as an urban agglomeration with a population exceeding 10 million people. In 1950, only New York and Tokyo qualified. By 2024, there are approximately 35–40 megacities worldwide [UN World Urbanization Prospects 2024] — a near-complete shift in where human concentration now occurs.
Table 6: World’s Largest Urban Agglomerations (2024)
| Rank | City / Urban Area | Country | Population (Millions) | Region | Annual Growth Rate |
|---|---|---|---|---|---|
| 1 | Tokyo | Japan | ~37.0 | East Asia | ~0.0% (stable) |
| 2 | Delhi | India | ~33.0 | South Asia | ~2.5% |
| 3 | Shanghai | China | ~29.0 | East Asia | ~1.2% |
| 4 | Dhaka | Bangladesh | ~23.0 | South Asia | ~3.5% |
| 5 | São Paulo | Brazil | ~22.6 | Latin America | ~0.8% |
| 6 | Mexico City | Mexico | ~22.1 | North America | ~0.9% |
| 7 | Cairo | Egypt | ~22.0 | N. Africa | ~2.1% |
| 8 | Beijing | China | ~22.0 | East Asia | ~1.5% |
| 9 | Mumbai | India | ~21.3 | South Asia | ~1.8% |
| 10 | Osaka | Japan | ~19.0 | East Asia | ~0.0% |
| 11 | Chongqing | China | ~17.4 | East Asia | ~2.5% |
| 12 | Karachi | Pakistan | ~17.2 | South Asia | ~2.8% |
| 13 | Istanbul | Turkey | ~15.9 | Europe/Asia | ~1.5% |
| 14 | Kinshasa | DR Congo | ~15.6 | Sub-Saharan Africa | ~4.2% |
| 15 | Lagos | Nigeria | ~15.4 | Sub-Saharan Africa | ~3.8% |
| 16 | Buenos Aires | Argentina | ~15.3 | Latin America | ~0.8% |
| 17 | Kolkata | India | ~15.1 | South Asia | ~1.2% |
| 18 | Manila | Philippines | ~14.4 | Southeast Asia | ~2.2% |
| 19 | Tianjin | China | ~14.0 | East Asia | ~1.8% |
| 20 | Guangzhou | China | ~13.3 | East Asia | ~2.0% |
Source: UN World Urbanization Prospects 2024; UN-Habitat State of the World’s Cities 2022.
✅ Key Findings:
- Tokyo has held the position of world’s largest city since the 1960s — over six decades at the top
- Delhi is growing at approximately 2.5% per year and is projected to surpass Tokyo as the world’s largest city around 2030
- Asia accounts for approximately 15 of the top 20 largest urban agglomerations
- Kinshasa and Lagos show the fastest growth rates in the top 20 (~4.2% and ~3.8% respectively) — reflecting Sub-Saharan Africa’s rapid urbanization trajectory
Fastest Urbanizing Countries and Regions
The countries urbanizing most rapidly are not those already highly urbanized — they are predominantly those with the lowest current urban percentage and the highest population growth rates, concentrated in Sub-Saharan Africa and parts of South and Southeast Asia.
Table 7: Fastest Urbanizing Countries (Annual Rate, 2024)
| Country | Current Urban % | Annual Urbanization Rate | Urban Pop. (Millions) | Projected Urban % (2050) | Region |
|---|---|---|---|---|---|
| Burkina Faso | ~32% | ~5.6% | ~7.5 | ~62% | Sub-Saharan Africa |
| Niger | ~17% | ~5.4% | ~4.7 | ~42% | Sub-Saharan Africa |
| Tanzania | ~38% | ~5.2% | ~25 | ~68% | Sub-Saharan Africa |
| DR Congo | ~47% | ~4.8% | ~50 | ~72% | Sub-Saharan Africa |
| Mali | ~46% | ~4.7% | ~11 | ~71% | Sub-Saharan Africa |
| Guinea | ~37% | ~4.5% | ~5.2 | ~64% | Sub-Saharan Africa |
| Uganda | ~27% | ~4.4% | ~14 | ~55% | Sub-Saharan Africa |
| Mozambique | ~38% | ~4.3% | ~13 | ~65% | Sub-Saharan Africa |
| Ethiopia | ~23% | ~4.1% | ~30 | ~52% | Sub-Saharan Africa |
| Angola | ~68% | ~3.9% | ~24 | ~85% | Sub-Saharan Africa |
| Cambodia | ~25% | ~3.7% | ~4.2 | ~51% | Southeast Asia |
| Bangladesh | ~40% | ~3.5% | ~69 | ~63% | South Asia |
Source: UN World Urbanization Prospects 2024; World Bank Urban Development Data.
The statistical pattern is consistent: the countries with the lowest current urban percentage tend to have the highest annual urbanization rates because they have the most room to grow — mathematically, moving from 20% to 40% urban is a larger percentage point change per year than moving from 80% to 90%.
Slum and Informal Settlement Statistics
Not all urban growth translates into improved living conditions. The UN-Habitat definition of a slum describes a household lacking one or more of the following: durable housing, adequate living space, access to improved drinking water, access to improved sanitation, or security of tenure.
Approximately 1.1 billion people — roughly 24% of the global urban population — currently live in slum conditions [UN-Habitat World Cities Report 2022]. Despite significant improvements in some regions, the absolute number of slum dwellers continues to rise because urbanization in many low-income countries is outpacing the capacity of governments to provide infrastructure.
Table 8: Slum Population by Region (2023)
| Region | Slum Population (Millions) | % of Urban Pop. in Slums | Trend | Key Challenges |
|---|---|---|---|---|
| Sub-Saharan Africa | ~590 | ~56% | Worsening (absolute) | Infrastructure deficit; rapid growth |
| South Asia | ~360 | ~30% | Slowly improving | Sanitation; water access |
| East Asia & Pacific | ~82 | ~7% | Improving | Improving but pockets remain |
| Latin America | ~83 | ~15% | Stable/improving | Land tenure; services access |
| Middle East & N. Africa | ~45 | ~13% | Mixed | Conflict-driven informal growth |
| World Total | ~1,100 | ~24% | Rising (absolute) | Investment lag vs. urbanization speed |
Source: UN-Habitat World Cities Report 2022; UN-Habitat Global Slum Data.
Sub-Saharan Africa presents the most statistically concerning pattern: approximately 56% of urban residents live in slum conditions — in cities like Nairobi (Kibera district), Lagos, and Kinshasa, that figure exceeds 60% in specific districts [UN-Habitat 2022]. The mathematical explanation is straightforward: urban populations in these cities are growing at 3–5% per year, while government housing and infrastructure investment is growing at 1–2% per year — creating a widening gap measured in hundreds of thousands of underserved households annually.
Economic Impact of Urbanization
Cities are disproportionately productive. Despite housing approximately 57% of the world’s population, urban areas generate approximately 80% of global GDP [World Bank Urban Development Research; McKinsey Global Institute Urban World 2011, updated estimates 2022].
Table 9: Urban Economic Concentration (2024)
| Metric | Value | Source | Statistical Note |
|---|---|---|---|
| % of global GDP generated in cities | ~80% | World Bank / McKinsey Global Institute | Despite housing ~57% of population |
| Urban vs. rural GDP per capita ratio | ~3–4× | World Bank | Varies widely by country income level |
| % of global innovation from top 40 metro areas | ~75% | McKinsey Global Institute | Patents, R&D, startup activity |
| % of global energy consumption from cities | ~75% | IEA World Energy Outlook | Driven by industry and transport |
| % of global CO2 emissions from cities | ~70% | UN-Habitat / IEA | High density vs. high consumption |
| Urban wage premium vs. rural equivalent | ~30–50% | World Bank Labor Data | Varies by country and skill level |
Source: World Bank Urban Development Research; McKinsey Global Institute — Urban World Reports (2011, 2012, 2016); UN-Habitat.
The urban wage premium — the statistical advantage of urban employment over comparable rural employment — averages approximately 30–50% across developing economies [World Bank Labor Market Data]. This premium is the primary economic driver of rural-urban migration: individuals respond rationally to wage differentials, even accounting for higher urban living costs.
Urbanization and GDP — Statistical Relationship
The correlation between urbanization rate and GDP per capita is one of the strongest single relationships in development economics.
Table 10: Urban Percentage vs. GDP Per Capita — Selected Countries (2024)
| Country | Urban % | GDP Per Capita (USD, est.) | Income Group | Region |
|---|---|---|---|---|
| USA | 83% | ~$80,000 | High | North America |
| Japan | 92% | ~$33,000 | High | East Asia |
| Germany | 77% | ~$51,000 | High | Europe |
| South Korea | 81% | ~$33,000 | High | East Asia |
| Brazil | 88% | ~$10,000 | Upper-middle | Latin America |
| Egypt | 43% | ~$3,700 | Lower-middle | N. Africa |
| India | 36% | ~$2,500 | Lower-middle | South Asia |
| Tanzania | 38% | ~$1,100 | Low | Sub-Saharan Africa |
| Ethiopia | 23% | ~$1,000 | Low | Sub-Saharan Africa |
| Niger | 17% | ~$600 | Low | Sub-Saharan Africa |
| Burundi | 14% | ~$250 | Low | Sub-Saharan Africa |
| Papua New Guinea | 13% | ~$2,600 | Lower-middle | Oceania |
Source: World Bank GDP Per Capita Data (NY.GDP.PCAP.CD); World Bank Urban Population Data (SP.URB.TOTL.IN.ZS); 2024 estimates.
The correlation is strong and consistent: countries with higher urban percentages tend to have significantly higher GDP per capita. However, the relationship is not perfectly linear — Papua New Guinea (~13% urban, ~$2,600 GDP/capita) has higher income than some more urbanized low-income African countries due to mineral extraction. The Gulf states present a different pattern: very high urbanization driven by labor migration rather than industrial development. Correlation does not imply causation in this data — it is possible that economic growth causes urbanization, that urbanization causes economic growth, or that both are caused by a third factor (industrialization, institutional quality). For the statistical treatment of correlation measurement and interpretation, see the descriptive statistics page on LearnMinto.
Urban Population Growth — Worked Statistical Examples
Urban population growth follows the same compound growth formula as investment returns, population growth, and price level changes.
The Urban Growth Formula
U(t) = U₀ × (1 + r)^t
Where:
- U(t) = Urban population at time t
- U₀ = Starting urban population
- r = Annual urbanization growth rate (expressed as decimal)
- t = Number of years
Worked Example 1: Global Urban Population Growth (1990–2025)
Given values:
- U₀ = 2.0 billion (1990 global urban population)
- r = 2.0% = 0.020 per year (approximate average)
- t = 35 years (1990 to 2025)
Step 1 — Apply the formula:
U(35) = 2.0B × (1.020)^35
Step 2 — Calculate (1.020)^35:
(1.020)^35 = e^(35 × ln(1.020)) = e^(35 × 0.01980) = e^(0.6930) ≈ 2.000
Step 3 — Final result:
U(35) = 2.0B × 2.000 = ~4.0 billion
Actual 2025 figure: ~4.7 billion [UN WPP 2024]
The calculated result of ~4.0 billion versus the actual ~4.7 billion reflects a straightforward statistical explanation: urban growth rates were higher than 2.0% in the early 1990s (particularly in China and South Asia) and the average rate across the full period was closer to 2.3–2.4%. Using the geometric mean of actual annual growth rates — rather than a single assumed constant — would produce a more accurate result.
Worked Example 2: Lagos Urban Growth (2000–2024)
Given values:
- U₀ = 7 million (Lagos urban agglomeration, 2000)
- r = 3.5% = 0.035 per year
- t = 24 years (2000 to 2024)
Step 1 — Apply the formula:
U(24) = 7M × (1.035)^24
Step 2 — Calculate (1.035)^24:
(1.035)^24 = e^(24 × ln(1.035)) = e^(24 × 0.03440) = e^(0.8256) ≈ 2.283
Step 3 — Final result:
U(24) = 7M × 2.283 = ~16.0 million
Actual 2024 estimate: ~15–16 million [UN World Urbanization Prospects 2024]
This calculation is highly consistent with the observed figure, confirming that Lagos has maintained approximately 3.5% annual urban growth over this period — one of the highest sustained urban growth rates for any major city globally.
This urban growth formula uses the same compound growth mathematics explained on our Compound Interest Statistics page.
Urban Population Projections — 2030 and 2050
All projections below reflect the UN medium variant — the central estimate from the World Population Prospects and World Urbanization Prospects 2024. These are statistical projections with uncertainty ranges — actual outcomes will depend on fertility trends, economic development, migration policy, and climate factors.
Table 11: Urban Population Projections by Region — UN Medium Variant
| Region | Urban Pop. 2025 (M) | Urban Pop. 2030 (M, proj.) | Urban Pop. 2050 (M, proj.) | Urban % 2050 (proj.) | Additional Urban Residents 2025–2050 |
|---|---|---|---|---|---|
| Sub-Saharan Africa | ~640 | ~820 | ~1,600 | ~61% | +960M |
| South Asia | ~730 | ~870 | ~1,350 | ~56% | +620M |
| East Asia & Pacific | ~1,350 | ~1,430 | ~1,580 | ~77% | +230M |
| Latin America | ~545 | ~580 | ~680 | ~88% | +135M |
| North America | ~310 | ~330 | ~395 | ~89% | +85M |
| Europe | ~565 | ~578 | ~615 | ~83% | +50M |
| Middle East & N. Africa | ~340 | ~390 | ~570 | ~76% | +230M |
| World Total | ~4,700 | ~5,200 | ~6,680 | ~68% | +1,980M |
Source: UN World Urbanization Prospects 2024 — Medium Variant.
Between 2025 and 2050, the world will add approximately 2.0 billion urban residents — nearly equivalent to adding two current United States’ worth of urban population. Critically, approximately 48% of that growth will occur in Sub-Saharan Africa alone (+960 million), and approximately 31% in South Asia (+620 million). These two regions together will account for nearly 80% of all new urban residents over the next 25 years.
Table 12: Projected Largest Cities in 2050 — UN Medium Variant
| Proj. Rank | City | Country | 2050 Pop. (Projected, M) | 2024 Pop. (M) | Change | Region |
|---|---|---|---|---|---|---|
| 1 | Delhi | India | ~43 | ~33 | +~10M | South Asia |
| 2 | Cairo | Egypt | ~40 | ~22 | +~18M | N. Africa |
| 3 | Lagos | Nigeria | ~35 | ~15 | +~20M | Sub-Saharan Africa |
| 4 | Dhaka | Bangladesh | ~35 | ~23 | +~12M | South Asia |
| 5 | Mumbai | India | ~33 | ~21 | +~12M | South Asia |
| 6 | Kinshasa | DR Congo | ~33 | ~16 | +~17M | Sub-Saharan Africa |
| 7 | Tokyo | Japan | ~34 | ~37 | −~3M | East Asia |
| 8 | Karachi | Pakistan | ~31 | ~17 | +~14M | South Asia |
| 9 | Kolkata | India | ~28 | ~15 | +~13M | South Asia |
| 10 | Shanghai | China | ~28 | ~29 | −~1M | East Asia |
Source: UN World Urbanization Prospects 2024 — Medium Variant Projections.
The projected shift is geographically significant: Delhi is projected to become the world’s largest city around 2030 and hold that position through 2050. Lagos and Kinshasa — both in Sub-Saharan Africa — are projected to become two of the five largest cities in the world by 2050, reflecting the continent’s demographic trajectory. Tokyo and Shanghai are projected to remain large but grow slowly or decline slightly as East Asian populations age.
Urban Population Growth Calculator
LearnMinto Urban Population Growth Calculator
This calculator applies the standard compound urban growth formula to model how any starting urban population changes over time at a given annual growth rate.
Formula Applied: U(t) = U₀ × (1 + r)^t
Inputs:
- Starting Urban Population: __________
- Annual Urban Growth Rate (%): __________
- Time Horizon (Years): __________
- Current Urban % (optional — for context): __________%
Outputs:
- Projected urban population after t years
- Urban population as % of total (if total population entered)
- Doubling time estimate (Rule of 70: Doubling Time ≈ 70 / r%)
- Year when urban population reaches a user-defined target
Key Patterns From Global Urbanization Statistics
Pattern 1 — The 2007 Historical Crossover
For the first time in all of human history, more than 50% of the global population lived in cities in 2007. By 2025 that figure has risen to approximately 57% — and it has never returned below 50% since crossing the threshold. This shift from a rural to an urban majority, which took millennia to approach and only decades to finalize, represents the defining demographic transition of the 20th and 21st centuries.
Pattern 2 — Sub-Saharan Africa’s Dual Statistical Position
Sub-Saharan Africa is simultaneously the least urbanized major region (~43%) and the fastest urbanizing at approximately 3.6% per year. The region is projected to add approximately 960 million urban residents between 2025 and 2050 — the largest absolute addition of any world region. Most of this growth will occur in cities that currently lack the infrastructure to support it.
Pattern 3 — Megacity Concentration in Asia
Approximately 15 of the world’s top 20 megacities are located in Asia, and Tokyo (~37 million) has held the position of world’s largest city for over 60 consecutive years. Asia’s megacity dominance reflects both its share of world population (~57%) and the economic concentration effects that draw rural migrants to urban manufacturing and services centers.
Pattern 4 — The Slum Paradox
Despite rising average urban incomes globally, approximately 1.1 billion people — 24% of the global urban population — live in slum conditions [UN-Habitat, 2022]. The paradox is statistical: urbanization is increasing faster than infrastructure investment in many low-income countries, meaning the absolute number of slum dwellers rises even as the percentage improves in some regions.
Pattern 5 — Economic Concentration
Cities generate approximately 80% of global GDP while housing approximately 57% of the world’s population — a ratio that makes cities the most economically productive spatial units on Earth. The urban wage premium of 30–50% over rural equivalents is the primary statistical driver of continued rural-urban migration in developing economies.
Frequently Asked Questions
Q1: What percentage of the world lives in cities?
As of 2025, approximately 57% of the global population — roughly 4.7 billion people — lives in urban areas [UN World Urbanization Prospects 2024]. This figure has grown from approximately 30% in 1950 and is projected to reach approximately 68% by 2050. Urban areas are growing at approximately 2% per year, more than twice the overall world population growth rate of approximately 0.9% per year.
Q2: When did urban population exceed rural population?
The historic crossover occurred in 2007, when for the first time in human history, more than 50% of the global population lived in urban areas rather than rural areas [UN World Urbanization Prospects]. The crossover point was approximately 3.3 billion urban residents versus 3.3 billion rural residents. The urban percentage has grown every year since 2007 and is expected to continue rising through the end of this century.
Q3: Which region is the most urbanized?
North America is the most urbanized major world region, with approximately 83% of its population living in urban areas [UN WPP 2024]. The United States (~83% urban) and Canada (~82% urban) are both highly urbanized. Latin America and the Caribbean is close behind at approximately 82% urban, making it the second most urbanized major region and more urbanized than Europe (~75%).
Q4: What is a megacity?
A megacity is an urban agglomeration — a city and its surrounding continuously built-up urban area — with a population of 10 million or more people. In 1950, only two cities qualified (New York and Tokyo). By 2024, approximately 35–40 megacities exist globally [UN World Urbanization Prospects 2024]. Asia hosts approximately 15 of the top 20 by population, with Tokyo (~37 million) the largest.
Q5: How many people live in slums globally?
Approximately 1.1 billion people — roughly 24% of the global urban population — live in slum or informal settlement conditions as defined by UN-Habitat [World Cities Report 2022]. Sub-Saharan Africa has the highest concentration, with approximately 56% of urban residents living in slum conditions. Despite improvements in some regions, the absolute number of slum dwellers continues to rise because urbanization outpaces infrastructure investment in many low-income countries.
Q6: Which city will be the largest in 2050?
Delhi, India is projected to become the world’s largest city by approximately 2030 and remain at the top position through 2050, with a projected population of approximately 43 million [UN World Urbanization Prospects 2024, Medium Variant]. Tokyo, the current largest city (~37 million), is projected to slowly decline toward approximately 34 million by 2050 as Japan’s total population ages and contracts. Lagos and Kinshasa — both in Sub-Saharan Africa — are projected to rank among the world’s five largest cities by 2050.
Key Terms Glossary
Urbanization
The process by which an increasing proportion of a country’s population comes to live in urban areas — cities and towns — rather than rural areas. Driven by both rural-urban migration and natural population increase within cities.
Urban Agglomeration
A continuously built-up urban area extending beyond the administrative boundaries of a single city, including surrounding suburbs and satellite settlements. The basis for comparing city sizes in UN data.
Megacity
An urban agglomeration with a population of 10 million or more people. In 2024, there are approximately 35–40 megacities globally, concentrated primarily in Asia and increasingly in Sub-Saharan Africa.
Rural-Urban Migration
The movement of people from rural areas (countryside, agricultural regions) to urban areas (cities, towns), typically motivated by higher wages, better employment opportunities, improved services, and economic development.
Urban Sprawl
The outward spread of an urban area into surrounding rural land at low population densities, often driven by affordable land, car dependency, and decentralized development. Associated with longer commutes and higher infrastructure costs per resident.
Slum / Informal Settlement
A residential area characterized by inadequate housing, lack of clean water access, lack of adequate sanitation, overcrowding, insecure land tenure, or some combination of these deficiencies, as defined by UN-Habitat. Approximately 1.1 billion people live in slum conditions globally.
Urban Primacy
A condition where one city in a country is disproportionately large relative to the second-largest city, often concentrating economic activity, population, and political power. Common in developing countries; measured by the primacy index.
Counterurbanization
A demographic trend in which population and economic activity move from major urban areas toward smaller towns and rural areas. Most commonly observed in high-income countries after urban areas reach very high density.
Urban Heat Island
A phenomenon where urban areas experience significantly higher temperatures than surrounding rural areas, due to the replacement of vegetation with heat-absorbing surfaces (asphalt, concrete, buildings) and waste heat from energy use.
Urban Transition
The progression of a country from a predominantly rural to a predominantly urban society, typically associated with industrialization, rising incomes, and structural economic change from agriculture toward manufacturing and services.
Statistical Concepts Used On This Page
Compound Growth Formula: Urban population growth uses U(t) = U₀(1 + r)^t — the same compound growth formula used for investment returns and demographic models. See the Compound Interest Statistics page for the full formula derivation, step-by-step worked examples, and the mathematical explanation of why small differences in growth rate produce large differences in terminal population over long time horizons.
Geometric Mean: Average annual urbanization rates across multiple decades must be computed as geometric means — not arithmetic means — because growth compounds year over year. As shown in Worked Example 1, using a simple arithmetic average of 2.0% underestimates actual urban population growth because higher rates in earlier years have a larger compound base effect.
World Population Context: Urbanization statistics are a subset of total population data. The urban percentage in any country can only be interpreted meaningfully in the context of that country’s total population, growth rate, and demographic structure. For country-level population rankings, density statistics, fertility data, and long-run demographic projections, see our World Population Statistics page, which provides the broader demographic framework within which urbanization trends operate.
Further Reading & Data Sources
United Nations World Urbanization Prospects 2024 (population.un.org/wup)
The definitive global urbanization database, updated biennially by the UN Population Division. Source for all urban population estimates, regional breakdowns, megacity rankings, and long-run projections in this article.
World Bank Urban Development Data (data.worldbank.org)
Country-level urban population percentage, GDP per capita, urban growth rates, and infrastructure indicators. All World Bank series are freely downloadable as CSV with full historical records.
UN-Habitat — World Cities Report 2022 (unhabitat.org)
The primary source for slum population statistics, informal settlement data, urban inequality indicators, and city-level quality-of-life assessments. Published every two to four years.
Our World in Data — Urbanization (ourworldindata.org/urbanization)
Long-run historical urban population data from approximately 1800 to the present, with interactive visualizations and downloadable datasets. Source for the 1800–1950 historical data in Table 5.
McKinsey Global Institute — Urban World Reports (mckinsey.com/mgi)
Research on urban economic concentration, GDP generation in cities, and the economic impact of urbanization in developing economies. Reports published 2011, 2012, and 2016 with updated data cited in secondary literature.
References
- United Nations World Urbanization Prospects 2024
- World Bank Urban Development Indicators
- UN-Habitat World Cities Report 2022
- Our World in Data — Urbanization
- McKinsey Global Institute — Urban World
Disclaimer:
This article is intended for educational and informational purposes only. While LearnMinto strives to provide accurate and up-to-date urbanization statistics, readers should verify important data through official sources including the United Nations World Urbanization Prospects, World Bank, and UN-Habitat before using this content for academic, policy, or research purposes. Urban population projections are estimates based on current trends and carry inherent uncertainty. LearnMinto is not affiliated with any government agency, research institution, or international organization.