
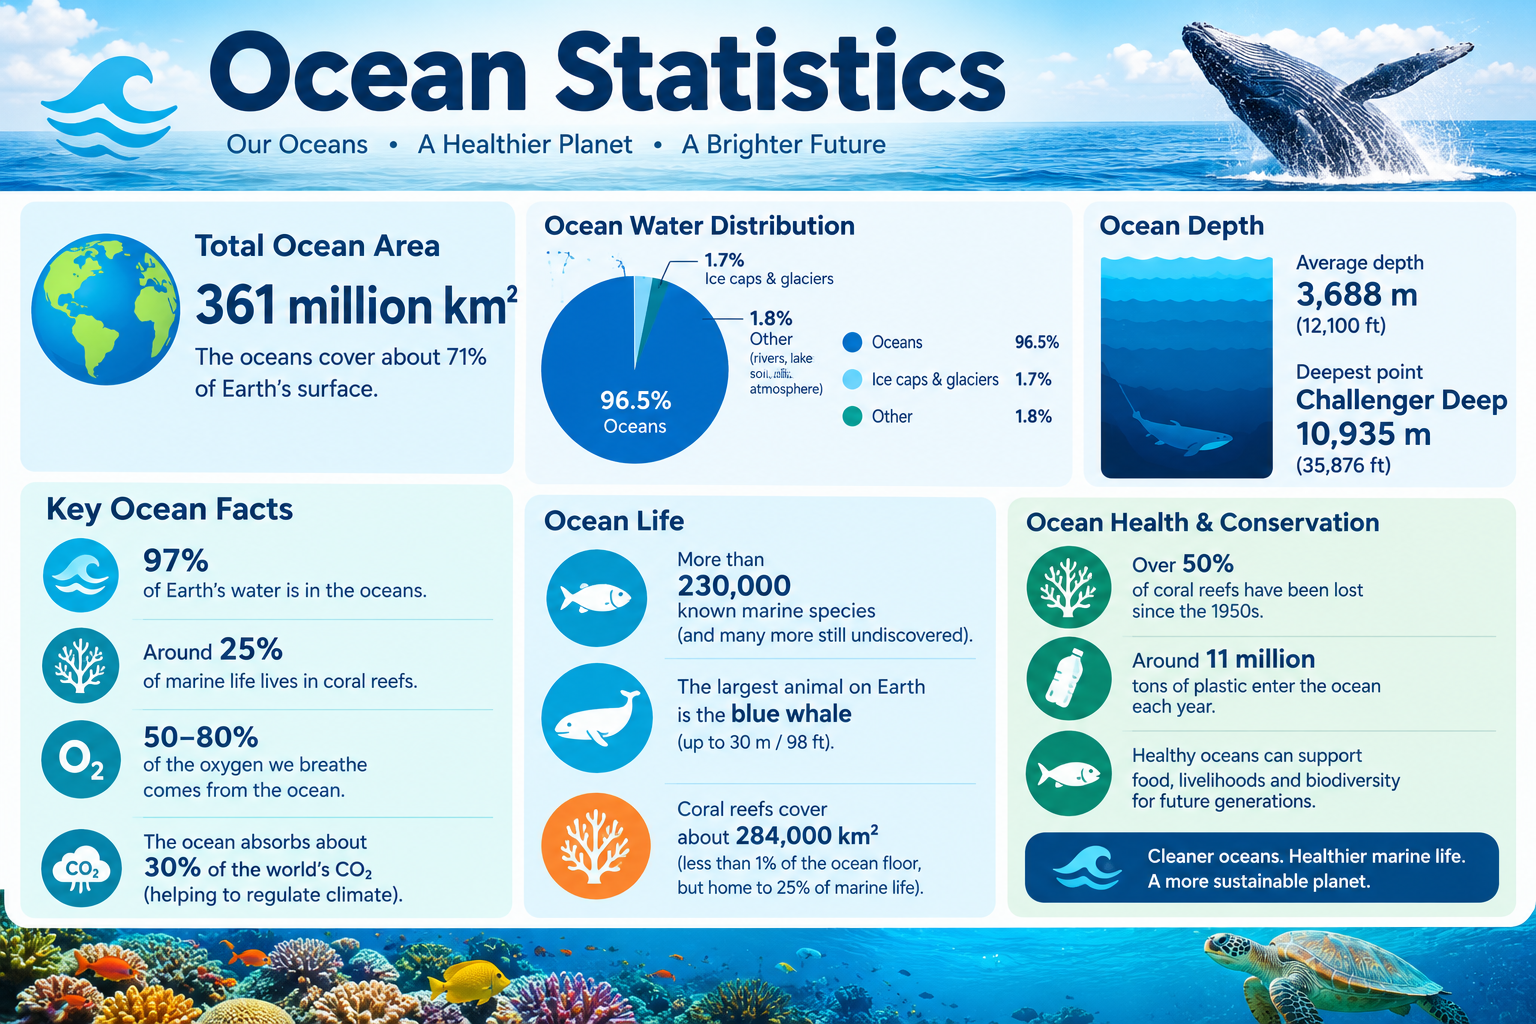
The Pacific Ocean alone covers approximately 165.25 million square kilometers — larger than all of Earth’s landmasses combined. Yet the deepest point in that same ocean, Challenger Deep in the Mariana Trench, plunges to approximately 10,935 meters — deep enough to submerge Mount Everest with over 2,000 meters to spare.
This page compiles primary-source ocean statistics covering the size, depth, temperature, salinity, and key data for all 5 oceans — through 2024–2025.
What This Page Covers
✓ Total world ocean area and volume
✓ Size comparison of all 5 oceans (km² and miles²)
✓ Ocean depth statistics — average and maximum
✓ Ocean temperature data by ocean and depth zone
✓ Ocean salinity statistics and comparisons
✓ Ocean current systems and their scale
✓ Marine biodiversity statistics by ocean
✓ Ocean pollution and plastic statistics
✓ Sea level rise data and projections
✓ Statistical concepts: mean, median, range, percentage, ratio, standard deviation
Executive Summary — Key Ocean Statistics
~361 Million km²
Total World Ocean Area
~165.25 Million km²
Largest Ocean: Pacific
~10,935 m
Deepest Point: Challenger Deep
~3,688 m
Average Ocean Depth
⚠️ Data Disclaimer
All ocean statistics on this page are sourced from primary international sources including NOAA, the National Geographic Society, the International Hydrographic Organization (IHO), and the World Ocean Atlas. Ocean measurements may vary slightly between sources due to differing boundary definitions, measurement methodologies, and ongoing scientific updates. This page is statistical reference material for educational purposes only.
Primary Sources: NOAA Ocean Facts | National Geographic Society | International Hydrographic Organization (IHO) | World Ocean Atlas 2023 | IPCC AR6 | OBIS | The Ocean Cleanup
Section 1: Total World Ocean Area and Volume — Key Facts
The world’s oceans cover approximately 361 million square kilometers (~139.4 million square miles), representing 70.8% of Earth’s total surface area of ~510 million km². Put simply, for every square kilometer of land on Earth, there are roughly 2.4 square kilometers of ocean.
The total volume of all ocean water combined is approximately 1.335 billion km³ — a figure so large it is difficult to visualize through comparison alone. The average depth across all oceans is ~3,688 meters (~12,100 feet), though depth varies enormously between ocean basins and specific locations.
One distinction worth clarifying early: an ocean is one of the five major, continuous bodies of salt water that together form the world’s connected ocean system. A sea is smaller, typically partially enclosed by land — such as the Mediterranean Sea or Caribbean Sea. Seas are components within ocean systems, not separate from them.
The International Hydrographic Organization (IHO) officially recognized the Southern Ocean as the fifth ocean in 2000, and National Geographic updated its reference maps accordingly in 2021. Before that, most educational materials listed only four oceans.
Table 1: World Ocean — Key Measurements
| Component | Measurement | Unit | Notes |
|---|---|---|---|
| Total Ocean Surface Area | ~361 | Million km² | 70.8% of Earth’s surface |
| Total Ocean Volume | ~1.335 | Billion km³ | All 5 oceans combined |
| Average Depth | ~3,688 | Meters | Global average across all basins |
| Maximum Depth (Challenger Deep) | ~10,935 | Meters | Mariana Trench, Pacific Ocean |
| Average Surface Temperature | ~17 | °C (62.6°F) | Global surface average |
| Average Salinity | ~35 | PSU (ppt) | Practical Salinity Units |
| % of Earth’s Water in Oceans | ~96.5% | — | Remaining in ice, groundwater, rivers |
| World Total Coastline Length | ~620,000 | Kilometers | Approximate; varies by methodology |
Sources: NOAA Ocean Facts; World Ocean Atlas 2023; International Hydrographic Organization
Section 2: Size Comparison of All 5 Oceans
The five oceans vary considerably in size. The Pacific Ocean is not just the largest — it is larger than all of Earth’s land surface combined (~149 million km²). The Arctic Ocean, at the other end of the scale, is smaller than Russia alone.
The Atlantic Ocean is geologically the youngest ocean, formed as the supercontinent Pangaea broke apart approximately 180 million years ago. The Southern Ocean is unique in that its boundaries are defined not by land but by the Antarctic Circumpolar Current — the only current that flows continuously around the entire planet.
Table 2: All 5 Oceans — Size Comparison (2024)
| Rank | Ocean | Area (Million km²) | Area (Million miles²) | % of World Ocean | % of Earth’s Surface | Borders |
|---|---|---|---|---|---|---|
| 1 | Pacific Ocean | 165.25 | 63.80 | 45.8% | 32.4% | Asia, Americas, Australia, Antarctica |
| 2 | Atlantic Ocean | 106.46 | 41.10 | 29.5% | 20.9% | Americas, Europe, Africa |
| 3 | Indian Ocean | 70.56 | 27.24 | 19.5% | 13.8% | Africa, Asia, Australia, Antarctica |
| 4 | Southern Ocean | 21.96 | 8.48 | 6.1% | 4.3% | Antarctica (defined by current) |
| 5 | Arctic Ocean | 14.06 | 5.43 | 3.9% | 2.8% | North America, Europe, Asia |
Sources: NOAA; National Geographic Society; International Hydrographic Organization (IHO)
✅ Key Finding: The Pacific Ocean alone accounts for 45.8% of all ocean area — more than the Atlantic and Indian Oceans combined.
✅ Key Finding: The Arctic Ocean is the shallowest and smallest ocean, with significant seasonal sea ice coverage reducing its navigable surface.
Section 3: Ocean Depth Statistics — Average and Maximum Depths
Depth is one of the most statistically varied characteristics across the five oceans. The Pacific is both the largest and the deepest on average, while the Arctic is the shallowest by a considerable margin.
Challenger Deep, located in the Mariana Trench in the western Pacific, is the deepest confirmed point on Earth at approximately 10,935 meters (35,876 feet). To put this in context: if Mount Everest — at 8,849 meters — were placed at the bottom of Challenger Deep, its summit would still sit approximately 2,086 meters below sea level.
Table 3: Ocean Depth Data — All 5 Oceans (2024)
| Ocean | Avg Depth (m) | Avg Depth (ft) | Max Depth (m) | Max Depth (ft) | Deepest Point | Location |
|---|---|---|---|---|---|---|
| Pacific | 4,028 | 13,215 | 10,935 | 35,876 | Challenger Deep | Mariana Trench |
| Atlantic | 3,332 | 10,932 | 8,376 | 27,480 | Puerto Rico Trench | North Atlantic |
| Indian | 3,963 | 13,002 | 7,258 | 23,812 | Java/Sunda Trench | Eastern Indian |
| Southern | 3,270 | 10,728 | 7,235 | 23,737 | South Sandwich Trench | South Atlantic boundary |
| Arctic | 1,205 | 3,953 | 5,625 | 18,454 | Molloy Deep | Fram Strait |
Sources: NOAA Ocean Facts; Scripps Institution of Oceanography; GEBCO (General Bathymetric Chart of the Oceans)
The ocean floor itself is divided into distinct structural zones. Moving from the coastline outward and downward, these include the continental shelf (shallow, gently sloping), the continental slope (steep drop-off), the abyssal plain (flat deep floor), and the hadal zone — ocean trenches deeper than 6,000 meters.
Section 4: Ocean Depth Zones — Explained with Data
Only the uppermost layer of the ocean receives enough sunlight for photosynthesis. Below approximately 200 meters, sunlight effectively disappears, and the ocean transitions into permanent darkness. This single fact shapes nearly all marine life distribution.
Approximately 95% of the ocean’s total volume exists below the sunlight zone — in conditions of total darkness, near-freezing temperatures, and pressures that would crush unprotected equipment.
Table 4: Ocean Depth Zones — Definitions and Key Facts
| Zone | Depth Range (m) | Light? | Temperature Range (°C) | Key Features | % of Ocean Volume |
|---|---|---|---|---|---|
| Sunlight / Epipelagic | 0–200 | Full sunlight | 0–30°C | Photosynthesis; most marine life | ~2–3% |
| Twilight / Mesopelagic | 200–1,000 | Faint/none | 4–15°C | Bioluminescence common; diel migration | ~7% |
| Midnight / Bathypelagic | 1,000–4,000 | None | 2–4°C | High pressure; chemosynthetic life | ~30% |
| Abyssal / Abyssopelagic | 4,000–6,000 | None | 1–3°C | Abyssal plains; sparse but diverse life | ~54% |
| Hadal Zone | >6,000 | None | ~0–2°C | Ocean trenches; extreme pressure ecosystems | <1% |
Sources: NOAA Ocean Service; Woods Hole Oceanographic Institution (WHOI)
✅ Key Finding: The hadal zone covers less than 1% of the ocean floor yet contains organisms adapted to pressures exceeding 600 atmospheres.
Section 5: Ocean Temperature Statistics
Ocean surface temperatures vary significantly by ocean, latitude, and season. The warmest ocean surface temperatures are found in the tropical Indian Ocean and western Pacific, while the coldest are recorded in the Arctic and Southern Oceans — where surface water can drop to -1.8°C, the approximate freezing point of salt water.
A significant warming trend has been confirmed across all ocean basins. Global ocean surface temperature has risen by approximately 0.13°C per decade since 1901. The year 2023 recorded the highest average global ocean surface temperature ever measured, with a global anomaly of approximately +0.9°C above the 20th century average.
Table 5: Ocean Surface Temperature by Ocean (2024)
| Ocean | Avg Surface Temp (°C) | Avg Surface Temp (°F) | Warmest Recorded (°C) | Coldest Recorded (°C) | Seasonal Variation |
|---|---|---|---|---|---|
| Pacific | ~16.4 | ~61.5 | ~31 (tropical west) | ~-1.8 (polar regions) | Moderate–High |
| Atlantic | ~16.7 | ~62.1 | ~30 (tropical) | ~-1.8 (north polar) | High |
| Indian | ~17.0 | ~62.6 | ~34 (Persian Gulf area) | ~-1.8 (southern edge) | Moderate |
| Southern | ~2.0 | ~35.6 | ~10 (summer, northern edge) | ~-1.8 (at ice surface) | Low |
| Arctic | ~-1.0 | ~30.2 | ~7 (summer, some regions) | ~-1.8 (under ice) | High (seasonal ice) |
Sources: NOAA NCEI; World Ocean Atlas 2023; Copernicus Climate Change Service
Table 6: Ocean Temperature by Depth Zone (Global Average)
| Depth Zone | Depth (m) | Avg Temperature (°C) | Avg Temperature (°F) | Notes |
|---|---|---|---|---|
| Surface | 0–200 | ~17 | ~62.6 | Varies by latitude and season |
| Thermocline | 200–1,000 | ~15 to ~4 | ~59 to ~39 | Rapid temperature drop |
| Deep Ocean | 1,000–4,000 | ~2–4 | ~36–39 | Near-stable, cold year-round |
| Abyssal | >4,000 | ~1–2 | ~34–36 | Very stable; slow circulation |
| Hadal | >6,000 | ~0–2 | ~32–36 | Near-freezing; sometimes below 0°C |
Sources: NOAA NCEI; World Ocean Atlas 2023; Copernicus Climate Change Service
Section 6: Ocean Salinity Statistics
Salinity measures the concentration of dissolved salts in water. It is expressed in Practical Salinity Units (PSU) — equivalent to parts per thousand (ppt). The average salinity of the world’s oceans is approximately 35 PSU, meaning 35 grams of dissolved salt per kilogram of seawater.
For context: human blood has a salinity of approximately 9 PSU — meaning ocean water is roughly four times saltier than blood. The Dead Sea, while not an ocean, reaches approximately 300 PSU — nearly nine times the ocean average.
The Arctic Ocean is the least saline ocean at approximately 28–30 PSU, due to substantial freshwater input from melting sea ice and major rivers including the Ob, Yenisei, and Lena. The Atlantic, by contrast, has the highest average salinity among the five oceans, particularly in the North Atlantic subtropical gyre.
Table 7: Ocean Salinity Data — All 5 Oceans
| Ocean | Avg Salinity (PSU) | Saltiest Region | Least Salty Region | Key Factors Affecting Salinity |
|---|---|---|---|---|
| Pacific | ~34.5 | Tropical east (~36 PSU) | North Pacific (~32 PSU) | Large river input; high rainfall |
| Atlantic | ~35.5 | North Atlantic subtropical | Baltic Sea boundary (~10 PSU) | High evaporation; fewer large rivers |
| Indian | ~34.7 | Red Sea (~41 PSU) | Bay of Bengal (~30 PSU) | Monsoon rainfall; river discharge |
| Southern | ~34.0 | Northern boundary | Near Antarctic ice (~33 PSU) | Ice melt dilution; cold temperatures |
| Arctic | ~28–30 | Central basin | Near river mouths (~10 PSU) | Major river inflow; ice melt |
Sources: NOAA; World Ocean Atlas 2023; IAPSO
Table 8: Salinity Comparison — Oceans vs. Other Water Bodies
| Water Body | Salinity (PSU) | Classification | Notes |
|---|---|---|---|
| Average Ocean | ~35 | Saltwater | Global baseline reference |
| Atlantic Ocean | ~35.5 | Saltwater | Saltiest of the five oceans |
| Pacific Ocean | ~34.5 | Saltwater | Largest ocean; slightly lower salinity |
| Arctic Ocean | ~28–30 | Saltwater | Least salty ocean globally |
| Red Sea | ~41 | Saltwater sea | High evaporation; no river input |
| Dead Sea | ~300 | Hypersaline lake | Not an ocean; extreme salinity |
| Baltic Sea | ~10 | Brackish | High freshwater inflow from rivers |
| Human Blood | ~9 | Body fluid | Comparison reference only |
| Freshwater River | <0.5 | Freshwater | Rivers and lakes typically <0.5 PSU |
Sources: NOAA; World Ocean Atlas 2023; IAPSO (International Association for the Physical Sciences of the Oceans)
Section 7: Ocean Current Systems and Their Scale
Ocean currents are continuous, directed movements of seawater driven by wind, temperature differences, salinity gradients, and Earth’s rotation. They function as the ocean’s circulatory system — distributing heat, nutrients, and dissolved gases across the planet.
Volume transport in ocean currents is measured in Sverdrups (Sv), where 1 Sv = 1 million cubic meters of water per second. To put that in perspective, 1 Sv is approximately 1,000 times the discharge of the Amazon River.
Table 9: Major Ocean Current Systems — Key Data
| Current Name | Ocean | Type | Speed (km/h) | Volume Transport (Sv) | Significance |
|---|---|---|---|---|---|
| Gulf Stream | Atlantic | Warm | ~5–9 | ~30 Sv | Moderates European climate |
| Antarctic Circumpolar Current | Southern | Cold | ~3–5 | ~130–150 Sv | Largest current by volume on Earth |
| Kuroshio Current | Pacific | Warm | ~3–7 | ~42 Sv | Pacific equivalent of Gulf Stream |
| Humboldt/Peru Current | Pacific | Cold | ~1–3 | ~20 Sv | Drives major Pacific fisheries |
| Agulhas Current | Indian | Warm | ~3–5 | ~70 Sv | One of fastest western boundary currents |
| Labrador Current | Atlantic | Cold | ~1–2 | ~10 Sv | Affects northeastern North America climate |
| Thermohaline Circulation | Global | Mixed | Very slow | ~15–20 Sv (deep water) | Global “conveyor belt”; ~1,000-year cycle |
Note: 1 Sverdrup (Sv) = 1 million m³/second
Sources: NOAA Ocean Service; Woods Hole Oceanographic Institution (WHOI); NASA Physical Oceanography
The Antarctic Circumpolar Current transports an estimated 130–150 Sv of water — making it the single largest ocean current on Earth by volume. The global thermohaline circulation, which connects all ocean basins through deep water formation and surface return flows, takes approximately 1,000 years to complete one full cycle.
Section 8: Marine Biodiversity Statistics by Ocean
The world’s oceans host an extraordinary range of life. Approximately 240,000–250,000 marine species have been formally identified and catalogued. However, scientists estimate the actual total may reach 700,000 to 1,000,000 species — meaning the majority of ocean life remains undiscovered.
Coral reefs, though covering only approximately 284,300 km² — less than 1% of the ocean floor — support an estimated 25% of all marine species. They represent the ocean’s most biodiverse ecosystems by area, often compared to tropical rainforests in terms of species density.
Table 10: Marine Biodiversity — Estimates by Ocean
| Ocean | Est. Marine Species | Known Coral Reef Area (km²) | Key Threatened Species | Biodiversity Hotspot |
|---|---|---|---|---|
| Pacific | ~100,000–120,000 | ~180,000 | Sea turtles, sharks, whales | Coral Triangle (~5.7M km²) |
| Atlantic | ~60,000–80,000 | ~60,000 | Atlantic bluefin tuna, right whale | Caribbean reefs |
| Indian | ~50,000–70,000 | ~35,000 | Dugong, whale shark, hawksbill turtle | Maldives, Seychelles reefs |
| Southern | ~8,000–10,000 | Negligible | Emperor penguin, Antarctic krill, leopard seal | Scotia Sea |
| Arctic | ~5,000–7,000 | None (too cold) | Polar bear, narwhal, walrus | Barents Sea ecosystems |
Sources: Ocean Biodiversity Information System (OBIS); IUCN Red List; NOAA Coral Reef Watch
✅ Key Finding: The Coral Triangle in the Pacific Ocean — spanning parts of Indonesia, the Philippines, and Papua New Guinea — is considered the global center of marine biodiversity, containing roughly 76% of all known coral species.
Section 9: Ocean Pollution and Plastic Statistics
The world’s oceans face significant and measurable pollution pressures. Plastic pollution is among the most documented — with an estimated 150–170 million tonnes of plastic currently present in the world’s oceans, and approximately 8–10 million tonnes of new plastic entering each year.
The Great Pacific Garbage Patch, located between Hawaii and California, covers approximately 1.6 million km² — roughly twice the surface area of Texas. It is not a solid island of plastic but a diffuse zone of microplastics and larger debris concentrated by ocean currents.
Oceans also absorb approximately 25–30% of all human CO₂ emissions annually. While this slows atmospheric warming, it causes ocean acidification — the ocean’s pH has dropped from approximately 8.2 to 8.1 since the Industrial Revolution, representing a 26% increase in acidity on the logarithmic pH scale.
Table 11: Ocean Pollution — Key Global Statistics (2024)
| Pollution Type | Estimated Quantity | Main Source | Most Affected Region | Trend |
|---|---|---|---|---|
| Total plastic in oceans | ~150–170 million tonnes | Land-based waste, fishing | North Pacific, South Pacific | Increasing |
| Microplastics | Trillions of particles | Plastic degradation, textiles | All ocean surfaces | Increasing |
| Annual new plastic input | ~8–10 million tonnes/yr | Mismanaged waste | Coastal developing regions | Slight slowdown |
| Active ocean dead zones | ~700+ worldwide | Agricultural nitrogen/phosphorus runoff | Gulf of Mexico, Baltic Sea | Increasing |
| CO₂ absorbed annually | ~25–30% of human emissions | Fossil fuels, deforestation | Global (all oceans) | Increasing |
| Ocean pH change since 1800s | -0.1 pH units | CO₂ absorption (acidification) | Global surface waters | Ongoing decline |
| Oil spill incidents (post-1970) | 1,000s tracked | Tanker accidents, offshore drilling | All major shipping routes | Declining large spills |
Sources: UNEP; Ocean Conservancy; The Ocean Cleanup research data; NOAA; IPCC Ocean Reports
Section 10: Sea Level Rise — Data and Projections
Global mean sea level has risen measurably throughout the 20th and 21st centuries, driven primarily by thermal expansion of warming ocean water and the melting of glaciers and ice sheets. The rate of rise has accelerated over time.
From 1901 to 2018, global mean sea level rose by approximately 20 centimeters at an average rate of ~1.7 mm per year. Since satellite altimetry began in 1993, the measured rate has increased to approximately 3.7 mm per year — and current estimates for 2024 suggest the rate has further accelerated to approximately 4.4 mm per year.
Sea level rise is not geographically uniform. Some coastal regions experience significantly higher rise due to land subsidence, changes in ocean circulation, and gravitational effects from melting ice sheets. Countries including the Maldives, Tuvalu, Bangladesh, Marshall Islands, and parts of the Netherlands face the most direct risk.
Table 12: Sea Level Rise — Historical and Projected Data
| Time Period | Sea Level Change | Rate (mm/year) | Key Driver | Source |
|---|---|---|---|---|
| 1901–2018 | +~200 mm total | ~1.7 mm/yr | Thermal expansion + glacier melt | IPCC AR6 |
| 1993–2024 | +~100 mm total | ~3.7 mm/yr | Accelerated ice sheet loss | NASA/Copernicus |
| 2024 (current rate) | Ongoing | ~4.4 mm/yr | Ice sheet + thermal expansion | Copernicus 2024 |
| RCP 2.6 (2100 projection) | +0.3–0.6 m | — | Low emissions scenario | IPCC AR6 |
| RCP 4.5 (2100 projection) | +0.4–0.8 m | — | Intermediate emissions scenario | IPCC AR6 |
| RCP 8.5 (2100 projection) | +0.6–1.1 m | — | High emissions (worst case) | IPCC AR6 |
Sources: IPCC Sixth Assessment Report (AR6) 2021; NASA Sea Level Change Portal; NOAA Tide Gauge Records; Copernicus Climate Change Service
✅ Key Finding: Every 1 centimeter of sea level rise is estimated to displace approximately 6 million people in low-lying coastal areas globally.
Section 11: Statistical Analysis — Comparing the 5 Oceans
The five ocean size values form a small but statistically informative dataset. Understanding how they compare using standard statistical measures helps place each ocean in proper mathematical context.
Formula:
Percentage of World Ocean = (Ocean Area ÷ 361,000,000) × 100
Worked Example — Ratio Calculation:
The Pacific Ocean is approximately 11.75 times larger than the Arctic Ocean.
Calculation: 165.25M ÷ 14.06M = 11.75
This means that for every 1 km² of Arctic Ocean, there are 11.75 km² of Pacific Ocean.
Key Distribution Statistics:
- Total (sum of 5 oceans): ~378 million km² (including marginal seas; base ocean basin total ~361M km²)
- Mean ocean size: ~361M ÷ 5 = approximately ~72.2 million km²
- Median: Indian Ocean at ~70.56 million km² — very close to the mean
- Largest value: Pacific at 165.25 million km²
- Smallest value: Arctic at 14.06 million km²
- Range: 165.25 – 14.06 = 151.19 million km²
- Standard deviation: approximately ~55 million km² (significant spread)
Table 13: Statistical Summary — 5 Ocean Size Data
| Statistic | Value (Million km²) | Ocean (if applicable) |
|---|---|---|
| Total (sum of 5 oceans) | ~378 | All (including marginal seas) |
| Mean | ~72.2 | — |
| Median | ~70.56 | Indian Ocean |
| Mode | N/A | No repeating values |
| Range | ~151.19 | Pacific to Arctic |
| Largest value | ~165.25 | Pacific Ocean |
| Smallest value | ~14.06 | Arctic Ocean |
| Standard deviation (approx.) | ~55+ | — |
Sources: NOAA; IHO; National Geographic Society
This distribution of ocean sizes shows moderate right skew — the Pacific pulls the mean slightly above the median. However, with only five data points, the skew is less pronounced than in country size data. The Pacific is clearly an outlier within this small dataset, sitting more than 93 million km² above the mean.
Section 12: Largest Seas Within Each Ocean
Every ocean contains named seas — smaller, semi-enclosed water bodies that sit within or at the margins of the larger ocean basin. The largest sea within each ocean provides useful context for understanding regional geography.
The Sargasso Sea, located in the North Atlantic, is uniquely defined — it is the only sea in the world with no land boundaries, enclosed entirely by four ocean currents: the Gulf Stream, the North Atlantic Current, the Canary Current, and the North Atlantic Equatorial Current.
Table 14: Largest Seas by Ocean (2024)
| Ocean | Largest Sea | Area (km²) | Avg Depth (m) | Notes |
|---|---|---|---|---|
| Pacific | Philippine Sea | ~5,700,000 | ~4,108 | Largest sea on Earth by area |
| Atlantic | Sargasso Sea | ~3,100,000 | ~4,500 | Only sea with no land boundaries |
| Indian | Arabian Sea | ~3,862,000 | ~2,734 | Important shipping route; monsoon-driven |
| Southern | Weddell Sea | ~2,800,000 | ~3,000 | Site of Antarctic bottom water formation |
| Arctic | Barents Sea | ~1,400,000 | ~230 | Shallow; important fishing ground |
Sources: NOAA; Britannica; National Geographic Society
✅ Key Finding: The Philippine Sea (~5.7 million km²) is the largest sea on Earth — larger than the entire Mediterranean Sea and Arabian Sea combined.
✅ Key Finding: The Coral Sea (Pacific) contains the Great Barrier Reef (~344,400 km²) — the world’s largest coral reef system, visible from space.
Section 13: Ocean Statistics Comparison Calculator
🧮 Ocean Statistics Comparison Calculator — LearnMinto
How This Calculator Works
Inputs:
- Ocean A — Select from dropdown (Pacific / Atlantic / Indian / Southern / Arctic)
- Ocean B — Select from dropdown (Pacific / Atlantic / Indian / Southern / Arctic)
- Comparison Metric — Choose from: Area / Average Depth / Surface Temperature / Salinity
Outputs the calculator generates:
- Value for Ocean A (selected metric, with unit)
- Value for Ocean B (selected metric, with unit)
- How many times larger / deeper / warmer / saltier Ocean A is than Ocean B
- Percentage of world ocean area each covers
- Text-based ratio description for easy reading
Example Output:
“The Pacific Ocean (165.25M km²) is approximately 11.75 times larger than the Arctic Ocean (14.06M km²). The Pacific covers 45.8% of all ocean area. The Arctic covers 3.9% of all ocean area.”
Section 14: Key Patterns From Global Ocean Statistics
1. Pacific Dominance in Every Category
The Pacific Ocean covers approximately 45.8% of all ocean area and 32.4% of Earth’s total surface — making it larger than all land on Earth combined. It is also the deepest ocean on average (4,028m) and contains the greatest marine biodiversity of any ocean basin.
2. The Depth Extreme Between Oceans
The difference between the shallowest ocean (Arctic, average 1,205m) and the deepest (Pacific, average 4,028m) is 2,823 meters — a vertical difference larger than many significant mountain heights. This reflects fundamentally different geological structures between ocean basins.
3. A 30°C Surface Temperature Range
Surface temperatures across the world’s oceans range from approximately +28°C in the tropical Indian Ocean to -1.8°C at the ice edge of the Arctic and Southern Oceans — a total range of nearly 30°C within the same connected body of water.
4. The Atlantic Salinity Paradox
Despite being smaller than the Pacific, the Atlantic Ocean maintains a higher average salinity (~35.5 PSU vs. ~34.5 PSU). This occurs because the Atlantic loses more water through evaporation than it gains through river input, while the Pacific receives discharge from far more large rivers including the Amazon and Mekong.
5. Ocean Warming is Accelerating
Global ocean surface temperatures reached record highs in 2023, with a global anomaly of approximately +0.9°C above the 20th century average. The rate of ocean warming has approximately doubled since 1993 compared to the period 1969–1993, according to Copernicus Climate Change Service data.
Section 15: Frequently Asked Questions
Q1: Which is the largest ocean in the world?
The Pacific Ocean is the largest ocean in the world, covering approximately 165.25 million km² (63.8 million square miles). It accounts for roughly 45.8% of all ocean area and 32.4% of Earth’s total surface. The Pacific stretches from the Arctic in the north to the Southern Ocean in the south, and is bordered by Asia and Australia to the west and the Americas to the east. Source: NOAA; National Geographic Society.
Q2: Which is the deepest ocean in the world?
The Pacific Ocean is also the deepest ocean, with an average depth of approximately 4,028 meters (13,215 feet). Its deepest point — Challenger Deep in the Mariana Trench — reaches approximately 10,935 meters (35,876 feet) below sea level, making it the deepest known location on Earth’s surface. If Mount Everest were placed at the bottom, its peak would still be over 2,000 meters underwater. Source: NOAA Ocean Facts; GEBCO.
Q3: How many oceans are there in the world?
There are officially 5 oceans: the Pacific, Atlantic, Indian, Southern, and Arctic. The Southern Ocean was formally recognized as the fifth ocean by the International Hydrographic Organization (IHO) in 2000, and National Geographic updated its official maps to reflect this in 2021. Before that recognition, most educational resources listed only four oceans, treating the Southern Ocean as extensions of the Pacific, Atlantic, and Indian Oceans. Source: IHO; National Geographic Society.
Q4: What is the average temperature of the ocean?
The global average surface temperature of the world’s oceans is approximately 17°C (62.6°F), though this varies substantially by location and depth. In the deep ocean below 1,000 meters, temperatures stabilize between 2–4°C year-round. In 2023, global average ocean surface temperature reached record highs, with an anomaly of approximately +0.9°C above the 20th century average. Source: NOAA NCEI; World Ocean Atlas 2023; Copernicus Climate Change Service.
Q5: Which ocean is the saltiest?
The Atlantic Ocean has the highest average salinity of the five oceans, at approximately 35.5 PSU overall, with some regions of the North Atlantic subtropical gyre reaching 37 PSU or higher. The Atlantic is saltier than the Pacific primarily because it loses more water through evaporation and receives proportionally less freshwater from rivers. The least salty ocean is the Arctic, at approximately 28–30 PSU, due to significant freshwater input from ice melt and major Siberian rivers. Source: NOAA; World Ocean Atlas 2023; IAPSO.
Q6: How much of Earth is covered by oceans?
Oceans cover approximately 361 million km², representing 70.8% of Earth’s total surface area of ~510 million km². Land covers the remaining 29.2% (~149 million km²). Of the ocean-covered area, only the top 200 meters (~epipelagic zone) receives enough sunlight to support photosynthesis — meaning the vast majority of ocean volume exists in permanent darkness. Source: NOAA Ocean Facts; UN Statistics Division; NASA Earth Observatory.
Section 16: Key Terms Glossary
Ocean
An ocean is one of the five major, continuous divisions of the world’s interconnected body of salt water, covering approximately 70.8% of Earth’s surface. Oceans are distinguished from seas by their greater size and their position as the primary divisions of the global ocean system.
Sea
A sea is a smaller body of salt water that is partially or fully enclosed by land, or defined by geographic and oceanographic boundaries within a larger ocean. Examples include the Mediterranean Sea, Arabian Sea, and Caribbean Sea — all of which are components of larger ocean basins.
Salinity
Salinity is the concentration of dissolved salts in a body of water, measured in Practical Salinity Units (PSU) or parts per thousand (ppt). The average salinity of the world’s oceans is approximately 35 PSU, though this varies between ocean basins, depths, and proximity to freshwater sources.
Thermocline
The thermocline is a layer within the ocean where water temperature decreases rapidly with depth, typically found between 200 and 1,000 meters. It acts as a barrier separating the warmer, lighter surface water from the cold, denser deep ocean below.
Bathymetry
Bathymetry is the scientific measurement and mapping of the depth and topography of the ocean floor, equivalent to topography for land surfaces. Modern bathymetric data is collected using multibeam sonar systems and satellite altimetry, compiled in databases such as GEBCO.
Exclusive Economic Zone (EEZ)
An Exclusive Economic Zone (EEZ) is a maritime zone extending 200 nautical miles from a country’s coastline within which that nation holds exclusive rights to explore and exploit natural resources. EEZ areas can far exceed a country’s land area, particularly for island nations with overseas territories.
Ocean Current
An ocean current is a continuous, directed movement of ocean water driven by wind, temperature and salinity differences, Earth’s rotation (Coriolis effect), and the shape of ocean basins. Currents are measured in Sverdrups (Sv), where 1 Sv equals 1 million cubic meters of water per second.
Abyssal Plain
An abyssal plain is a flat or very gently sloping area of the deep ocean floor, typically found between 3,000 and 6,000 meters depth. Abyssal plains cover approximately 40% of the ocean floor and represent the largest habitat on Earth by area.
Hadal Zone
The hadal zone refers to the deepest parts of the ocean, found within ocean trenches at depths greater than 6,000 meters. Despite extreme pressure, near-freezing temperatures, and complete darkness, the hadal zone supports specialized communities of organisms including amphipods, polychaete worms, and unique microbial life.
Thermohaline Circulation
Thermohaline circulation is the global system of ocean currents driven by differences in water temperature (thermo) and salinity (haline), which affect water density and cause it to sink or rise. Often called the “ocean conveyor belt,” this circulation system takes approximately 1,000 years to complete one full cycle and plays a critical role in regulating Earth’s climate.
Section 17: Statistical Concepts Used On This Page
📖 Statistical Concepts Used On This Page
Range, Mean, Median, and Standard Deviation
Ocean size data provides a clear example of statistical range and spread. The Pacific Ocean (165.25M km²) is nearly 12 times the size of the Arctic Ocean (14.06M km²), creating a range of ~151 million km² within a dataset of just 5 values. The mean (~72.2M km²) sits close to the median (Indian Ocean, ~70.56M km²), indicating only moderate skew — unlike highly skewed datasets such as country land areas. For the statistical explanation of range, mean, median, and standard deviation, see our descriptive statistics page.
Population Density and Coastal Geography
Understanding ocean statistics in context requires knowing where people live relative to coastlines. Approximately 40% of the world’s population lives within 100km of a coast, making ocean health — water temperature, sea level, fishery availability, and pollution levels — directly relevant to human demographics and economic activity. For global population data and coastal population figures, see our World Population Statistics page.
Ocean and Land as Complementary Datasets
Oceans and land areas are complementary datasets — oceans cover 70.8% of Earth’s surface while land covers 29.2%. Comparing ocean area to land area data puts both datasets in full global context and reveals how unevenly distributed Earth’s surface types truly are. For complete land area data by country and continent, see our Land Area Statistics page.
Section 18: Further Reading and Data Sources
NOAA Ocean Facts — oceanservice.noaa.gov
Authoritative US ocean data covering depth, temperature, salinity, marine science, and ocean phenomena — updated regularly and freely accessible to students and researchers.
National Geographic Society — nationalgeographic.com
Ocean boundary definitions and geographic reference data for all 5 oceans, including the updated 2021 maps formally recognizing the Southern Ocean.
International Hydrographic Organization — iho.int
Official ocean boundary definitions, including the foundational publication “Limits of Oceans and Seas” which established the formal recognition of the Southern Ocean in 2000.
World Ocean Atlas 2023 — ncei.noaa.gov/products/world-ocean-atlas
Comprehensive oceanographic data including temperature, salinity, dissolved oxygen, and nutrient profiles by depth zone — the primary scientific reference for ocean physical properties.
IPCC Sixth Assessment Report AR6 (2021) — ipcc.ch/report/ar6
Sea level rise projections, ocean warming trend data, and ocean acidification findings from the leading international body on climate science.
OBIS — Ocean Biodiversity Information System — obis.org
Marine species data and biodiversity statistics by ocean region, compiled from thousands of datasets contributed by research institutions worldwide.
The Ocean Cleanup — theoceancleanup.com
Plastic pollution data, Great Pacific Garbage Patch research findings, and updated estimates of ocean plastic accumulation and distribution.
Internal LearnMinto Cross-Links:
-
Land Area Statistics — ocean vs. land area comparisons in global context
-
World Population Statistics — coastal population and ocean-dependent communities
-
Urbanization Statistics — coastal city growth and proximity to ocean systems
References
- NOAA Ocean Service (2024). Ocean Facts and Key Measurements. https://oceanservice.noaa.gov
- National Geographic Society (2021). Ocean Reference — All Five Oceans. https://www.nationalgeographic.com
- International Hydrographic Organization (2000/2021). Limits of Oceans and Seas — Special Publication No. 23. https://iho.int
- NOAA National Centers for Environmental Information (2023). World Ocean Atlas 2023. https://www.ncei.noaa.gov/products/world-ocean-atlas
- IPCC (2021). Sixth Assessment Report (AR6) — Working Group I: The Physical Science Basis. https://www.ipcc.ch/report/ar6/wg1/
- Ocean Biodiversity Information System (2024). OBIS Marine Species Data. https://obis.org
- The Ocean Cleanup (2023). Ocean Plastic Research and Data. https://theoceancleanup.com
- Woods Hole Oceanographic Institution (2024). Ocean Depth Zones and Deep Ocean Science. https://www.whoi.edu
- NASA Sea Level Change Portal (2024). Global Mean Sea Level. https://sealevel.nasa.gov
- Copernicus Climate Change Service (2024). Ocean Surface Temperature Records and Monitoring. https://climate.copernicus.eu
- GEBCO (2023). General Bathymetric Chart of the Oceans — Ocean Depth Data. https://www.gebco.net
- Scripps Institution of Oceanography (2024). Ocean Depth and Physical Oceanography. https://scripps.ucsd.edu
Disclaimer:
This article is intended for educational and informational purposes only. While LearnMinto strives to provide accurate and up-to-date ocean statistics, readers should verify important data through official sources including NOAA, the International Hydrographic Organization, and the World Ocean Atlas before using this content for academic, policy, or research purposes. Ocean measurements may vary slightly between sources due to differing boundary definitions and measurement methodologies. LearnMinto is not affiliated with any government agency, scientific institution, or international organization.