
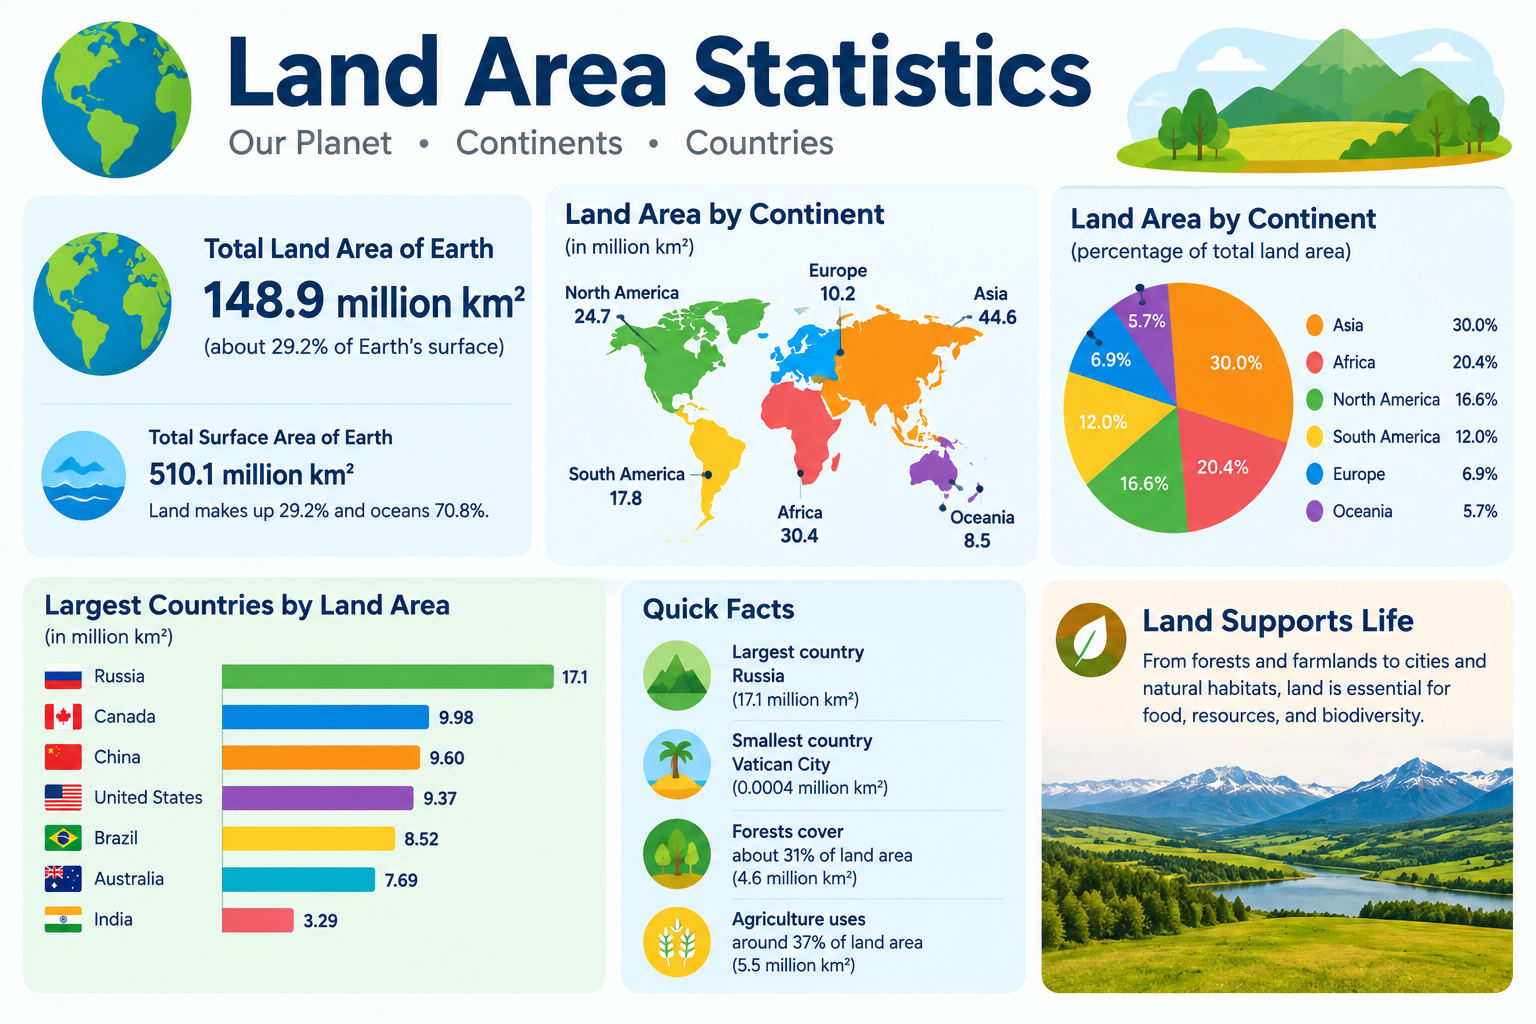
Russia covers approximately 17.1 million square kilometers — so large that it spans 11 time zones and is nearly twice the size of the entire continent of Antarctica. Yet Vatican City, the world’s smallest country by area, covers just 0.44 square kilometers — meaning you could fit approximately 38.8 million Vatican Cities inside Russia.
This page compiles primary-source land area statistics covering the largest and smallest countries by size, continental land areas, territorial waters, and the complete data on how the world’s ~195 countries compare by total area — through 2024–2025.
What This Page Covers
✓ Total world land area — key measurements
✓ Top 10 largest countries by area (km² and miles²)
✓ Top 10 smallest countries by area
✓ Land area by continent — complete comparison
✓ Land area vs. population density comparison
✓ Countries with largest exclusive economic zones (EEZ)
✓ Forest and agricultural land area statistics
✓ Land area change — erosion, reclamation, climate data
✓ Interactive land area comparison calculator
✓ Statistical concepts: ratio, percentage, density, standard deviation, distribution
Executive Summary — Key Land Area Statistics
~149 Million km²
Total World Land Area
~17,098,242 km²
Largest Country: Russia
~0.44 km²
Smallest Country: Vatican City
~38.8 Million:1
Ratio of Russia to Vatican City
⚠️ Data Disclaimer
All land area data on this page is sourced from primary international sources including the CIA World Factbook, United Nations Statistics Division, and World Bank. Land area figures may vary slightly between sources due to differing definitions of coastline measurement, inland water inclusion, and territorial disputes. This page is statistical reference material for educational purposes only.
Primary Sources: CIA World Factbook (2024) | UN Statistics Division | World Bank Land Area Data | UN FAO | VLIZ Maritime Boundaries Database | Our World in Data
Section 1: Total World Land Area — Key Facts
The total land area of Earth is approximately 149 million square kilometers (roughly 57.5 million square miles). That figure represents 29.2% of Earth’s total surface area, which is approximately 510 million km². Oceans cover the remaining 70.8%, or around 361 million km².
One important distinction to understand is the difference between total area and land area. Total area includes inland water bodies such as lakes and rivers, while land area excludes them. This matters most for countries like Russia, Canada, and the United States, which contain enormous lakes and river systems. Canada, for example, has a total area of 9,984,670 km² but a land-only area of approximately 9,093,507 km² — a difference of nearly 900,000 km² attributable to inland water.
Table 1: Earth’s Surface Area — Key Measurements
| Component | Area (Million km²) | Area (Million miles²) | % of Total Surface |
|---|---|---|---|
| Total Earth Surface | ~510 | ~196.9 | 100% |
| Total Land Area | ~149 | ~57.5 | 29.2% |
| Total Ocean Area | ~361 | ~139.4 | 70.8% |
| Total Inland Water | ~2.7 | ~1.04 | 0.5% |
| Habitable Land | ~104 | ~40.1 | 20.4% |
| Agricultural Land | ~48 | ~18.5 | 9.4% |
| Forest Coverage | ~40.6 | ~15.7 | 7.9% |
| Desert/Barren Land | ~33 | ~12.7 | 6.5% |
Sources: UN Statistics Division; NASA Earth Observatory; Our World in Data — Land Use
Section 2: Top 10 Largest Countries by Area
The ten largest countries by total area collectively cover approximately 49% of the world’s land surface. Russia alone accounts for ~11.5% of all land on Earth — a figure that is difficult to appreciate without direct comparison.
One frequently debated data point is the difference between the USA and China. The two countries are separated by only approximately 237,000 km² in most datasets, and the ranking can shift slightly depending on whether a source includes coastal waters or counts disputed territories.
Australia is the only country that simultaneously qualifies as an entire continent — a unique geographic distinction no other nation holds.
Table 2: Top 10 Largest Countries by Total Area (2024)
| Rank | Country | Total Area (km²) | Total Area (miles²) | % of World Land | Continent | Time Zones |
|---|---|---|---|---|---|---|
| 1 | Russia | 17,098,242 | 6,601,668 | 11.5% | Europe/Asia | 11 |
| 2 | Canada | 9,984,670 | 3,855,100 | 6.7% | North America | 6 |
| 3 | USA | 9,833,517 | 3,796,742 | 6.6% | North America | 6 |
| 4 | China | 9,596,960 | 3,705,407 | 6.4% | Asia | 1 |
| 5 | Brazil | 8,515,767 | 3,287,956 | 5.7% | South America | 4 |
| 6 | Australia | 7,692,024 | 2,969,907 | 5.2% | Oceania | 3 |
| 7 | India | 3,287,263 | 1,269,219 | 2.2% | Asia | 1 |
| 8 | Argentina | 2,780,400 | 1,073,518 | 1.9% | South America | 1 |
| 9 | Kazakhstan | 2,724,900 | 1,052,090 | 1.8% | Asia | 2 |
| 10 | Algeria | 2,381,741 | 919,595 | 1.6% | Africa | 1 |
Sources: CIA World Factbook 2024; UN Statistics Division; World Bank Land Area Data
Section 3: Countries Ranked 11–30 by Area
Beyond the top ten, there is a further group of large nations — each exceeding 900,000 km². In total, 22 countries exceed 1 million km² in land area, and together these large-land nations account for approximately 75% of all land on Earth.
Table 3: Countries Ranked 11–30 by Total Area (2024)
| Rank | Country | Total Area (km²) | Continent |
|---|---|---|---|
| 11 | Democratic Republic of Congo | 2,344,858 | Africa |
| 12 | Saudi Arabia | 2,149,690 | Asia |
| 13 | Mexico | 1,964,375 | North America |
| 14 | Indonesia | 1,904,569 | Asia |
| 15 | Sudan | 1,861,484 | Africa |
| 16 | Libya | 1,759,540 | Africa |
| 17 | Iran | 1,648,195 | Asia |
| 18 | Mongolia | 1,564,116 | Asia |
| 19 | Peru | 1,285,216 | South America |
| 20 | Chad | 1,284,000 | Africa |
| 21 | Niger | 1,267,000 | Africa |
| 22 | Angola | 1,246,700 | Africa |
| 23 | Mali | 1,240,192 | Africa |
| 24 | South Africa | 1,219,090 | Africa |
| 25 | Colombia | 1,141,748 | South America |
| 26 | Ethiopia | 1,104,300 | Africa |
| 27 | Bolivia | 1,098,581 | South America |
| 28 | Mauritania | 1,030,700 | Africa |
| 29 | Egypt | 1,002,450 | Africa |
| 30 | Tanzania | 945,087 | Africa |
Sources: CIA World Factbook 2024; UN Statistics Division
Section 4: Top 10 Smallest Countries by Area
At the other end of the scale, the world’s smallest countries are remarkably compact. All 10 of the smallest countries combined cover less than approximately 1,200 km² — which is smaller than the city limits of Los Angeles (~1,300 km²).
Vatican City’s 0.44 km² is smaller than many individual city parks. Monaco, the second smallest at 2.02 km², holds the distinction of being the world’s most densely populated country, with approximately 26,150 people per km².
Table 4: Top 10 Smallest Countries by Total Area (2024)
| Rank | Country | Total Area (km²) | Equivalent in m²/acres | Region | Population (approx.) | Notes |
|---|---|---|---|---|---|---|
| 1 | Vatican City | 0.44 | 440,000 m² / 109 acres | Europe | ~800 | Sovereign city-state within Rome |
| 2 | Monaco | 2.02 | 2,020,000 m² / 499 acres | Europe | ~36,000 | World’s densest country |
| 3 | San Marino | 61.2 | 61.2M m² / 15,120 acres | Europe | ~34,000 | Landlocked within Italy |
| 4 | Liechtenstein | 160 | 160M m² / 39,536 acres | Europe | ~39,000 | Doubly landlocked |
| 5 | Malta | 316 | 316M m² / 78,097 acres | Europe | ~530,000 | Mediterranean island state |
| 6 | Maldives | 300 | 300M m² / 74,131 acres | Asia | ~520,000 | ~1,200 coral islands |
| 7 | Saint Kitts and Nevis | 261 | 261M m² / 64,494 acres | Caribbean | ~53,000 | Two-island federation |
| 8 | Marshall Islands | 181 | 181M m² / 44,733 acres | Pacific | ~42,000 | Atoll nation |
| 9 | Tuvalu | 26 | 26M m² / 6,425 acres | Pacific | ~11,000 | Highly vulnerable to sea rise |
| 10 | Nauru | 21 | 21M m² / 5,189 acres | Pacific | ~10,000 | World’s smallest island nation |
Sources: CIA World Factbook 2024; UN Statistics Division
Section 5: Land Area by Continent — Complete Comparison
Asia is by far the largest continent, covering approximately 44.6 million km² — around 30% of all land on Earth. Africa is second at approximately 30.4 million km². Together, Asia and Africa account for roughly half of the world’s land area.
Europe, while geographically part of the Eurasian landmass, is counted separately in most standard datasets. It is the second-smallest continent by land area yet contains 44 sovereign countries — the highest country density of any continent. Antarctica (~14.2 million km²) has no permanent residents and no sovereign countries, though seven nations maintain territorial claims there.
Table 5: Land Area by Continent (2024)
| Continent | Area (Million km²) | Area (Million miles²) | % of World Land | Countries | Largest Country | Smallest Country |
|---|---|---|---|---|---|---|
| Asia | ~44.6 | ~17.2 | 30.0% | 48 | Russia | Maldives |
| Africa | ~30.4 | ~11.7 | 20.4% | 54 | Algeria | Seychelles |
| North America | ~24.7 | ~9.5 | 16.5% | 23 | Canada | Saint Kitts and Nevis |
| South America | ~17.8 | ~6.9 | 11.9% | 12 | Brazil | Suriname |
| Antarctica | ~14.2 | ~5.5 | 9.5% | 0 | N/A (territorial claims) | N/A |
| Europe | ~10.5 | ~4.1 | 7.0% | 44 | Russia (European part) | Vatican City |
| Oceania | ~8.5 | ~3.3 | 5.7% | 14 | Australia | Nauru |
Sources: UN Statistics Division; Britannica Atlas Data; CIA World Factbook
Section 6: Land Area vs. Population — Density Comparison
Population density is calculated by dividing a country’s population by its land area in km². This single formula reveals extraordinary contrasts across countries of similar or even identical land sizes.
Formula: Population Density = Population ÷ Land Area (km²)
Mongolia, for example, has a land area of 1.56 million km² but a population of only approximately 3.4 million — giving a density of just 2.2 people per km². Singapore, by contrast, covers 728 km² with around 6 million residents — a density of roughly 8,358 people per km².
The standard deviation of population density across all countries is extremely high — in the thousands — illustrating just how spread out this dataset truly is across global geography.
Table 6: Land Area vs. Population — Selected Comparisons (2024)
| Country | Land Area (km²) | Population (approx.) | Density (per km²) | Compared To | Key Note |
|---|---|---|---|---|---|
| Russia | 17,098,242 | ~144M | ~9 | Bangladesh | Russia is 116× larger by area |
| Bangladesh | 147,570 | ~170M | ~1,152 | Russia | 128× higher density than Russia |
| Australia | 7,692,024 | ~26M | ~3.4 | United Kingdom | Australia is 32× larger |
| United Kingdom | 243,610 | ~67M | ~275 | Australia | ~80× more people per km² |
| Canada | 9,984,670 | ~38M | ~3.8 | South Korea | Canada is ~100× larger |
| South Korea | 100,210 | ~52M | ~519 | Canada | ~136× higher density |
| Mongolia | 1,564,116 | ~3.4M | ~2.2 | Singapore | 2,148× larger than Singapore |
| Singapore | 728 | ~6M | ~8,358 | Mongolia | World’s highest densities |
| Greenland | 836,330 | ~57,000 | ~0.07 | Bangladesh | Lowest density among territories |
| China | 9,596,960 | ~1.4B | ~148 | Russia | 16× higher density than Russia |
Sources: CIA World Factbook 2024; World Bank Population Density Data
Section 7: Largest Exclusive Economic Zones (EEZ)
An Exclusive Economic Zone (EEZ) is a maritime zone extending 200 nautical miles (approximately 370 km) from a country’s coastline. Within this zone, a nation holds exclusive rights over natural resources including fish, oil, and gas. For many island nations and countries with overseas territories, the EEZ is dramatically larger than their land area.
France provides the most striking example. With a land area of only 551,695 km², France maintains the world’s second-largest EEZ at approximately 11.7 million km² — thanks to overseas territories including French Polynesia, New Caledonia, and French Guiana. That gives France an EEZ-to-land ratio of approximately 21:1.
Table 7: Top 10 Countries by Exclusive Economic Zone (EEZ)
| Rank | Country | EEZ Area (Million km²) | Land Area (km²) | EEZ:Land Ratio | Notes |
|---|---|---|---|---|---|
| 1 | USA | ~11.4 | 9,833,517 | ~1.2:1 | Includes Hawaii, Guam, Puerto Rico |
| 2 | France | ~11.7 | 551,695 | ~21:1 | Overseas territories are key |
| 3 | Australia | ~8.5 | 7,692,024 | ~1.1:1 | Large coastline and island territories |
| 4 | Russia | ~7.6 | 17,098,242 | ~0.4:1 | Vast Arctic EEZ |
| 5 | Japan | ~4.5 | 377,930 | ~11.9:1 | Island nation with extensive coast |
| 6 | New Zealand | ~4.1 | 268,838 | ~15.3:1 | Pacific island territories included |
| 7 | Canada | ~5.6 | 9,984,670 | ~0.6:1 | Arctic and Atlantic zones |
| 8 | Brazil | ~3.7 | 8,515,767 | ~0.4:1 | Long Atlantic coastline |
| 9 | Mexico | ~3.3 | 1,964,375 | ~1.7:1 | Pacific and Gulf coasts |
| 10 | Indonesia | ~6.2 | 1,904,569 | ~3.3:1 | 17,000+ islands |
Sources: VLIZ Maritime Boundaries Database; NOAA Ocean Service EEZ Data
Section 8: Forest Area Statistics by Country
Land area is not uniform in how it is used or covered. Forest area is one of the most important sub-categories of land data. According to the UN Food and Agriculture Organization (FAO), the world’s total forest area is approximately 4.06 billion hectares (~40.6 million km²), which equals roughly 31% of global land area.
Notably, the world has lost approximately 100 million hectares of forest since 2000 — a figure that underscores the importance of tracking land cover changes over time.
Table 8: Largest Forest Areas by Country (2024)
| Country | Forest Area (Million km²) | % of Country Covered | % of World Forest | Trend |
|---|---|---|---|---|
| Russia | ~8.15 | ~49% | ~20% | Stable/slight loss |
| Brazil | ~5.3 | ~62% | ~13% | Losing (deforestation) |
| Canada | ~3.5 | ~35% | ~9% | Stable |
| USA | ~3.1 | ~33% | ~8% | Stable/slight gain |
| China | ~2.2 | ~23% | ~5% | Gaining (reforestation) |
| Australia | ~1.3 | ~17% | ~3% | Slight loss |
| DR Congo | ~1.56 | ~67% | ~4% | Losing |
| Indonesia | ~0.92 | ~50% | ~2% | Losing |
| India | ~0.72 | ~24% | ~2% | Gaining |
| Peru | ~0.74 | ~58% | ~2% | Slight loss |
Sources: UN FAO Global Forest Resources Assessment 2020; World Bank Forest Data
Section 9: Agricultural Land Area Statistics
Agricultural land globally covers approximately 4.8 billion hectares (~48 million km²), which represents roughly 38% of habitable land. This includes arable land, permanent crops, and permanent pastures.
Agricultural land is shrinking in some regions due to urbanization and soil degradation, while expanding in others — particularly in parts of South America and Sub-Saharan Africa — often at the cost of forest cover.
Table 9: Agricultural Land Area — Top Countries (2024)
| Country | Agricultural Land (Million ha) | % of Country’s Land | Main Crop Types | Region |
|---|---|---|---|---|
| China | ~527 | ~55% | Rice, wheat, vegetables | Asia |
| USA | ~405 | ~45% | Corn, soy, wheat | North America |
| Australia | ~353 | ~46% | Wheat, cattle, sheep | Oceania |
| Russia | ~216 | ~13% | Wheat, barley, sunflower | Europe/Asia |
| Brazil | ~283 | ~33% | Soy, sugarcane, cattle | South America |
| Argentina | ~148 | ~53% | Soy, corn, wheat | South America |
| India | ~179 | ~60% | Rice, wheat, pulses | Asia |
| Kazakhstan | ~222 | ~82% | Wheat, cattle | Asia |
| Sudan | ~100 | ~54% | Sorghum, millet | Africa |
| Mexico | ~108 | ~55% | Corn, wheat, cattle | North America |
Sources: UN FAO Land Use Data 2022; World Bank Agricultural Land Data
Section 10: Land Area Change — Reclamation and Erosion
Land areas are not perfectly fixed over time. Some countries actively increase their land through reclamation — the process of creating new land from the sea or wetlands. Others face land loss through sea-level rise, coastal erosion, and river delta changes driven by climate and geological processes.
Table 10: Notable Land Area Changes — Historical and Projected
| Country | Type of Change | Area Changed | Mechanism | Timeline | Note |
|---|---|---|---|---|---|
| Netherlands | Reclamation | ~7,000 km² gained | Polders and sea drainage | Centuries-long | ~17% of current land is reclaimed |
| Singapore | Reclamation | ~148 km² gained | Sand dredging and fill | 1960s–present | From ~580 km² to ~728 km² |
| Maldives | Erosion/Sea Rise | Ongoing land loss | Sea level rise (~3.7mm/yr) | Present–2100 | Avg elevation ~1.2m above sea level |
| Bangladesh | Mixed | Loss and gain | Coastal erosion + river silt | Ongoing | Net loss expected long term |
| UAE/Dubai | Reclamation | ~300 km² added | Artificial island construction | 2000s–present | Palm Jumeirah, The World Islands |
Sources: FAO; World Bank Climate Change Data; National Geographic Society
Section 11: Statistical Analysis — Distribution of Country Sizes
Country sizes follow one of the most right-skewed distributions in all of geography. Understanding this distribution is important for any student interpreting land area statistics accurately.
Formula:
Percentage of World Land = (Country Area ÷ 149,000,000) × 100
Worked Example:
Russia’s share = (17,098,242 ÷ 149,000,000) × 100 = ~11.5%
Vatican City’s share = (0.44 ÷ 149,000,000) × 100 = ~0.000000295%
Key Distribution Statistics:
- Mean country size: ~149M km² ÷ 195 countries = approximately ~764,000 km²
- Median country size: approximately ~70,000 km²
- Largest value (Russia): 17,098,242 km²
- Smallest value (Vatican City): 0.44 km²
- Standard deviation: estimated at ~1,500,000+ km² — extremely high
The mean (~764,000 km²) is nearly 11 times the median (~70,000 km²). This gap exists because a small number of very large countries pull the mean far above the typical country size.
Table 11: Distribution of Countries by Size Category
| Size Category | Area Range | No. of Countries | % of All Countries | Combined Area (km²) | % of World Land |
|---|---|---|---|---|---|
| Micro | < 1,000 km² | ~35 | ~18% | ~10,000 | < 0.01% |
| Very Small | 1,000–10,000 km² | ~45 | ~23% | ~200,000 | ~0.1% |
| Small | 10,000–100,000 km² | ~60 | ~31% | ~2,500,000 | ~1.7% |
| Medium | 100,000–500,000 km² | ~30 | ~15% | ~8,000,000 | ~5.4% |
| Large | 500,000–2,000,000 km² | ~15 | ~8% | ~15,000,000 | ~10% |
| Very Large | > 2,000,000 km² | ~10 | ~5% | ~73,000,000 | ~49% |
Sources: CIA World Factbook 2024; UN Statistics Division
✅ Key Finding: The ~10 very large countries (>2 million km²) control approximately 49% of world land area.
✅ Key Finding: The ~80 micro and very small countries together control less than 1% of world land.
This extreme right-skew in country sizes is a classic statistical distribution pattern. Because the mean country size (~764,000 km²) is far above the median (~70,000 km²), the mean is not representative of a typical country.
Section 12: Largest Countries by Area on Each Continent
Table 12: Largest Country by Area on Each Continent (2024)
| Continent | Largest Country | Area (km²) | % of Continent’s Land | Capital City |
|---|---|---|---|---|
| Asia | Russia (Asian portion) | ~13,100,000 | ~29% | Moscow |
| Africa | Algeria | 2,381,741 | ~7.8% | Algiers |
| North America | Canada | 9,984,670 | ~40.4% | Ottawa |
| South America | Brazil | 8,515,767 | ~47.8% | Brasília |
| Europe | Russia (European portion) | ~3,972,400 | ~37.8% | Moscow |
| Oceania | Australia | 7,692,024 | ~90.5% | Canberra |
| Antarctica | No sovereign country | ~14,200,000 | N/A | N/A |
Source: CIA World Factbook 2024
Russia spans both Europe and Asia. Its European portion alone — approximately 3.97 million km² — still makes it the largest country in Europe by a substantial margin. If Russia were excluded from European rankings, Ukraine (~603,550 km²) would rank first.
Algeria became Africa’s largest country in the current rankings following South Sudan’s independence from Sudan in 2011, which split Sudan and reshuffled the rankings significantly.
Section 13: Interactive Land Area Comparison Calculator
🧮 Land Area Comparison Calculator — LearnMinto
How This Calculator Works
Inputs:
- Country A — Select from dropdown list (all ~195 countries)
- Country B — Select from dropdown list (all ~195 countries)
- Custom area input (optional) — enter any area in km² for comparison
Outputs the calculator generates:
- Area of Country A in km²
- Area of Country B in km²
- How many times larger Country A is than Country B (or vice versa)
- What percentage of world land area each country covers
- A text-based visual ratio description
Example Output:
“Russia (17,098,242 km²) is approximately 1,713 times larger than Vatican City (0.44 km²). Russia covers 11.5% of world land area. Vatican City covers approximately 0.000000295% of world land.”
Section 14: Key Patterns From Global Land Area Statistics
1. Extreme Concentration of Land Ownership
The top 10 countries by area cover approximately 49% of world land, while the bottom 100 countries cover less than 3% combined. This concentration is one of the starkest inequalities visible in global geography data.
2. The Size-Density Paradox
Russia, with 17.1 million km², has a population density of just ~9 people per km². Monaco, with only 2.02 km², has a density of approximately ~26,150 people per km². The largest country and the densest country could hardly be more different.
3. Continental Dominance of Asia and Africa
Asia (~44.6M km²) and Africa (~30.4M km²) together cover approximately 50% of all land. Europe, by contrast, covers only ~7% of world land yet contains 44 sovereign countries — the highest country density of any habitable continent.
4. EEZ Extends Influence Far Beyond Land
France’s EEZ (~11.7 million km²) is approximately 21 times its land area — demonstrating how maritime territory can dwarf physical land size for countries with overseas possessions. For many small island nations, their EEZ represents their most economically significant territory.
5. Extreme Statistical Skew in Country Sizes
Country size distribution shows a strong positive (right) skew. The mean country size (~764,000 km²) is nearly 11 times the median (~70,000 km²). This means the average figure gives a misleading impression of what a “typical” country looks like.
Section 15: Frequently Asked Questions
Q1: What is the largest country in the world by area?
Russia is the largest country in the world by total area, covering approximately 17,098,242 km² (6,601,668 square miles). This figure includes both its European and Asian portions. Russia accounts for roughly 11.5% of the world’s total land surface and spans 11 time zones. Data is sourced from the CIA World Factbook 2024 and the UN Statistics Division.
Q2: What is the smallest country in the world by area?
Vatican City is the smallest country in the world, with a total area of just 0.44 km² (approximately 109 acres). It is an independent city-state located entirely within Rome, Italy, and serves as the headquarters of the Roman Catholic Church. Its population is approximately 800 people, making it one of the least populous nations on Earth as well.
Q3: What is the total land area of the world?
The total land area of Earth is approximately 149 million square kilometers (57.5 million square miles). This represents 29.2% of Earth’s total surface area of ~510 million km². The remaining 70.8% (~361 million km²) is covered by oceans. These figures are sourced from the UN Statistics Division and NASA Earth Observatory.
Q4: Which continent has the most land area?
Asia is the largest continent by land area, covering approximately 44.6 million km² — roughly 30% of all land on Earth. Africa is the second largest at approximately 30.4 million km². Together, Asia and Africa account for about half of the world’s total land area. Source: UN Statistics Division and Britannica Atlas Data.
Q5: How many countries are larger than 1 million km²?
Exactly 22 countries have a total area exceeding 1 million km². These 22 nations together cover approximately 75% of the world’s total land area. The list includes Russia, Canada, the USA, China, Brazil, Australia, India, Argentina, Kazakhstan, Algeria, and 12 others. Source: CIA World Factbook 2024.
Q6: What is an Exclusive Economic Zone (EEZ)?
An Exclusive Economic Zone (EEZ) is a maritime zone extending 200 nautical miles (approximately 370 km) from a country’s coastline, within which that country holds exclusive rights to explore and use natural resources — including fish, oil, and gas. EEZ areas can be far larger than a country’s land area, particularly for island nations. France, for example, has a land area of ~551,695 km² but an EEZ of approximately 11.7 million km² due to its overseas territories. Source: VLIZ Maritime Boundaries Database; NOAA Ocean Service.
Section 16: Key Terms Glossary
Total Area
Total area refers to the complete surface area of a country, including both land and inland water bodies such as lakes and rivers. This differs from “land area” in that it captures the full geographic extent of a territory regardless of water coverage.
Land Area
Land area is the measurement of a country’s surface that excludes inland water bodies, representing only the solid, dry terrain within its borders. This figure is typically smaller than total area for countries with significant lakes or rivers.
Exclusive Economic Zone (EEZ)
An EEZ is a maritime zone extending 200 nautical miles from a country’s coastline, granting exclusive resource rights to that nation. It can dramatically expand a country’s effective geographic reach beyond its physical land boundaries.
Population Density
Population density is the number of people per unit of land area, typically expressed as people per square kilometer. It is calculated by dividing total population by total land area and reveals how intensively a country’s land is occupied.
Territorial Waters
Territorial waters are the band of ocean extending up to 12 nautical miles from a country’s coastline, over which that nation exercises full sovereignty. Ships of other nations may pass through under the principle of “innocent passage.”
Continental Shelf
The continental shelf is the underwater extension of a continent’s land mass, reaching into the ocean before dropping to deep ocean floor. Countries have rights over resources on and beneath their continental shelf, which can extend beyond the EEZ in some cases.
Land Reclamation
Land reclamation is the process of creating new usable land from the sea, lake beds, or wetlands, typically through drainage, filling, or dredging. Singapore expanded its land area from approximately 580 km² to ~728 km² through reclamation over several decades.
Habitable Land
Habitable land refers to land that can support human settlement and agricultural activity, excluding deserts, ice sheets, and inhospitable terrain. Of Earth’s approximately 149 million km² of land, only around 104 million km² (~70%) is considered habitable.
Sovereign Territory
Sovereign territory is the land, water, and airspace over which a recognized state exercises full governmental authority and control. It is the legal and political basis for defining a country’s geographic boundaries.
Cadastral Survey
A cadastral survey is a detailed, official measurement and mapping of land parcels, boundaries, and ownership within a jurisdiction. National cadastral surveys form the basis for official land area figures used by governments and international databases.
Section 17: Statistical Concepts Used On This Page
📖 Statistical Concepts Used On This Page
Descriptive Statistics and Skewness
The distribution of country sizes is one of the most right-skewed datasets in geography. The mean country size (~764,000 km²) is nearly 11 times the median (~70,000 km²) because a small number of very large countries pull the mean upward. For the statistical explanation of mean, median, and skewness.
Population Density and Land Area Together
Land area statistics are most meaningful when combined with population data. Population density — calculated as population divided by land area — reveals how crowded or sparse each country truly is. For country-level population data, rankings, and density comparisons.
Urbanization and Land Use
Land area does not tell the whole story of how space is used. Urbanization — the percentage of population living in cities — determines what fraction of a country’s land is intensively developed versus rural or wilderness. For global urbanization data and city-level statistics, see our Urbanization Statistics page.
Section 18: Further Reading and Data Sources
CIA World Factbook — cia.gov/the-world-factbook
Country-by-country area data, time zones, and geographic facts updated annually. The most widely cited reference for national-level geographic statistics.
UN Statistics Division — unstats.un.org
Official land area data by country presented in standardized km² format. Serves as the definitive source for country comparisons used by international institutions.
World Bank Land Area Data — data.worldbank.org
Comparable land area series with long-run historical records enabling trend analysis across decades.
UN FAO Global Forest Resources Assessment — fao.org/forest-resources-assessment
Forest area data by country and global totals, published every five years with methodology documentation.
VLIZ Maritime Boundaries Database — vliz.be/vmdcdata/marbound
Official EEZ boundaries and area data compiled by the Flanders Marine Institute.
Our World in Data — Land Use — ourworldindata.org/land-use
Agricultural and forest land data with long-run historical trends and interactive visualizations.
Internal LearnMinto Cross-Links:
- World Population Statistics — for population density in context of land area
- Urbanization Statistics — for land use and urban coverage data
- Inflation Statistics — for land prices and cost of living in high-density areas
References
- CIA World Factbook (2024). Country Profiles: Area and Geographic Data. https://www.cia.gov/the-world-factbook/
- United Nations Statistics Division (2024). Land Area Data — Country Profiles. https://unstats.un.org
- World Bank (2024). Land Area (sq. km) — Data. https://data.worldbank.org/indicator/AG.LND.TOTL.K2
- UN Food and Agriculture Organization (2020). Global Forest Resources Assessment 2020. https://www.fao.org/forest-resources-assessment
- VLIZ — Flanders Marine Institute (2023). Maritime Boundaries Geodatabase. https://www.vliz.be/vmdcdata/marbound
- Our World in Data (2024). Land Use. https://ourworldindata.org/land-use
- NASA Earth Observatory (2023). Earth’s Surface and Land Area. https://earthobservatory.nasa.gov
- NOAA Ocean Service (2024). What is an Exclusive Economic Zone? https://oceanservice.noaa.gov
Disclaimer:
This article is intended for educational and informational purposes only. While LearnMinto strives to provide accurate and up-to-date land area statistics, readers should verify important data through official sources including the CIA World Factbook, United Nations Statistics Division, and World Bank before using this content for academic, policy, or research purposes. Land area figures may vary slightly between sources due to differing measurement methodologies and territorial dispute interpretations. LearnMinto is not affiliated with any government agency, mapping authority, or international organization.