
The average American who carries a ~$6,300 credit card balance at ~21.5% APR and pays only the minimum will spend approximately 22 years and ~$7,300 in interest to eliminate just $5,000 of debt — a statistical demonstration of compound interest working against the borrower. That single figure captures the central risk of revolving consumer credit: the rate of growth applied to unpaid balances exceeds almost every other form of widely available borrowing.
This page compiles primary-source credit card statistics covering average balances, APR trends, debt growth, demographic patterns, and the mathematical cost of revolving debt — all through 2024–2025.
What This Page Covers
✓ Average credit card balance per cardholder and household
✓ Historical APR trends and interest rate data
✓ Total U.S. credit card debt volume and growth rates
✓ Credit card debt by age, income, and region
✓ Cost of minimum payments — worked compound-interest example
✓ Credit utilization statistics and credit scoring impact
✓ Trends in delinquency and default rates
✓ Interactive debt payoff calculator
✓ Evidence-based debt reduction strategies
✓ Statistical concepts: compound interest, geometric mean, standard deviation
Executive Summary: The Scale of Revolving Debt
| Benchmark | Value | Source / Period |
|---|---|---|
| ~$6,329 | Average Balance Per Cardholder | Experian 2024 |
| ~21.5% | Average APR (Balance-Carrying) | Federal Reserve G.19 |
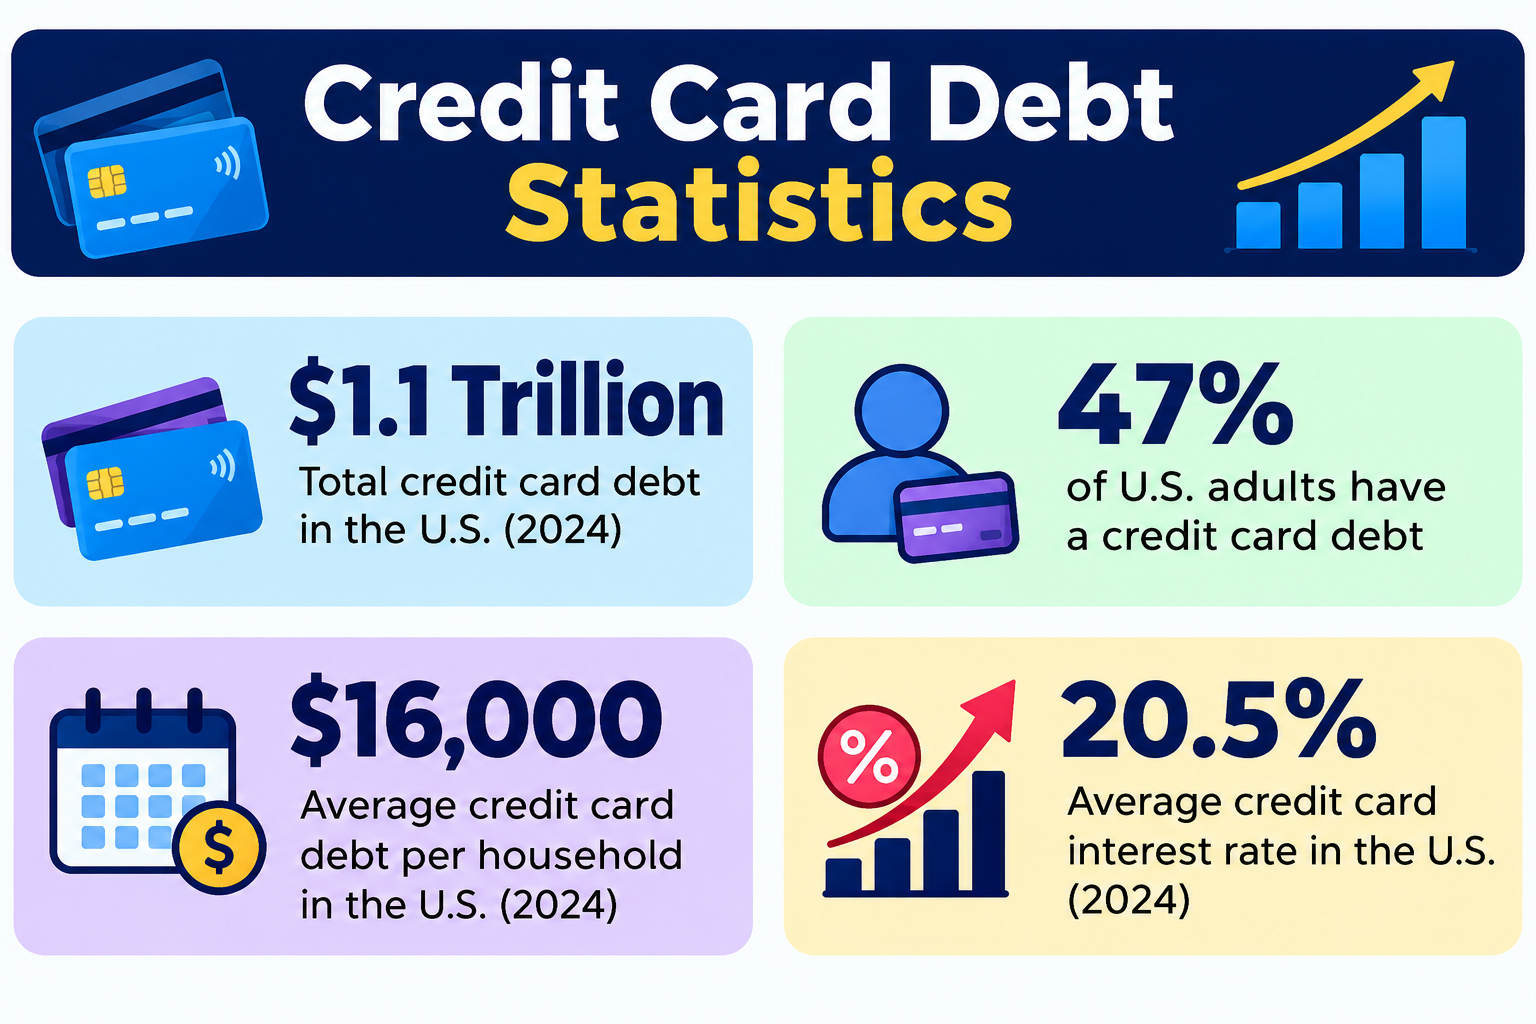
| ~$1.17 Trillion | Total U.S. Credit Card Debt | NY Fed Q4 2024 |
| ~48% | Americans Carrying Balance Monthly | American Bankers Association |
Credit card debt is the most expensive form of widely held consumer debt — with APRs consistently exceeding 20% since 2022. Total revolving debt crossed $1.17 trillion for the first time in U.S. history in 2024, surpassing the pre-pandemic peak even after adjusting for inflation.
⚠️ Important Disclaimer
All statistics on this page are for educational purposes only. This is statistical reference material about consumer debt — not financial advice or credit counseling. For personalized debt management guidance, consult a qualified nonprofit credit counseling agency.
Primary sources: Federal Reserve Board G.19 Consumer Credit; Federal Reserve Bank of New York Household Debt and Credit Report; Experian State of Credit 2024; Consumer Financial Protection Bureau (CFPB) Card Act Reports.
Section 1: Executive Summary & The Scale of Credit Card Debt
The ~$1.17 trillion figure represents all revolving credit card balances carried from month to month, not total transaction volume. Approximately 48% of American cardholders are “revolvers” — they carry a balance and pay interest — while the remaining ~52% pay in full each month (“transactors”). This distinction is critical: statistics about “average credit card debt” apply only to the revolving population unless explicitly stated otherwise.
Because revolving balances grow at compound rates exceeding 20%, even small balances can expand dramatically if left unaddressed. As shown in Section 6, a $5,000 balance at 24% APR produces approximately $7,314 in interest over 22 years when only minimum payments are made. The same debt paid with fixed $264 monthly payments costs only ~$336 in interest and is eliminated in 24 months — a difference of approximately 95% in total interest cost.
Section 2: Average Credit Card Balance — National Data
The term “average balance” requires careful statistical interpretation. The mean (~$6,329) is pulled upward by a small group of cardholders carrying very large balances (often $20,000+). The median balance — the value at the 50th percentile — is lower, typically estimated near ~$3,100 for cardholders who carry balances. Because debt distributions are strongly right-skewed, the median provides a more representative measure of the typical cardholder’s experience. See the mean vs. median vs. mode page on Statistics Fundamentals for why skewed distributions require median interpretation.
Table 1: Average Credit Card Balance — Key Metrics (2024)
| Metric | Value | Source | Note |
|---|---|---|---|
| Total U.S. Credit Card Debt | ~$1.17 Trillion | NY Fed Q4 2024 | Record nominal high |
| Avg Balance Per Cardholder | ~$6,329 | Experian 2024 | Includes zero-balance accounts |
| Avg Per Indebted Household | ~$9,200 | Experian / ABA | Only households with debt |
| Median Balance (Revolvers) | ~$3,100 | Experian Est. | More representative than mean |
| Avg Cards Per Adult | ~3.9 | Experian 2024 | Includes inactive accounts |
| Total Revolving Accounts | ~578 Million | NY Fed | All open revolving lines |
Source: Experian State of Credit 2024; Federal Reserve Bank of New York Quarterly Household Debt Report.
The gap between mean and median — over $3,200 — reflects a classic right-skewed financial distribution: a relatively small number of high-balance accounts pull the arithmetic mean upward, while the median remains closer to the typical borrower’s reality.
Section 3: Historical APR Trends — Interest Rate Data
The APR (Annual Percentage Rate) is the nominal annual rate applied to carried balances. For revolving accounts, interest is typically calculated using the daily periodic rate (APR ÷ 365) applied to the average daily balance, then summed monthly. This means a 21.5% APR produces an effective monthly rate of approximately 1.79%, and an effective annual rate of approximately 23.7% when compounded monthly.
Table 2: Average Credit Card APR by Year
| Year | Avg APR (All Accounts) | Avg APR (Balance-Carrying Only) | Fed Funds Rate | Spread (APR − Fed Rate) |
|---|---|---|---|---|
| 2015 | 14.9% | 15.9% | 0.13% | ~15.8 pp |
| 2018 | 16.9% | 17.8% | 2.40% | ~15.4 pp |
| 2019 | 17.0% | 17.3% | 2.15% | ~15.2 pp |
| 2020 | 14.7% | 16.3% | 0.36% | ~16.0 pp |
| 2022 | 19.2% | 20.4% | 1.68% → 4.33% | ~15.7 pp |
| 2023 | 20.7% | 21.5% | 5.08% | ~16.4 pp |
| 2024 | 21.0% | ~21.5% | 5.33% | ~16.2 pp |
| 2025 (est.) | ~21.5% | ~22.0% | ~4.75% | ~16.3 pp |
Source: Federal Reserve Board — G.19 Consumer Credit; CFPB Card Act Reports.
📊 Key Finding: The spread between credit card APRs and the Federal Funds Rate has widened to record levels — approximately 16 percentage points in 2024. Even as the Federal Reserve raised and then held rates, credit card issuers maintained historically wide margins, meaning borrowers did not receive proportional relief when policy rates stabilized.
Section 4: Credit Card Debt by Age Group
Debt burden follows a life-cycle pattern. Younger cardholders have lower absolute balances but often face higher APRs (due to shorter credit histories) and higher utilization rates (because their total available credit limits are lower). Middle-aged cardholders (45–54) typically carry the highest absolute balances, reflecting peak household spending on housing, education, and family costs.
Table 3: Credit Card Statistics by Age (2024)
| Age Group | Avg Balance | % Carrying Balance | Avg APR Paid | Utilization Rate (Est.) |
|---|---|---|---|---|
| 18–34 | ~$3,200 | ~41% | ~22.1% | ~28% |
| 35–44 | ~$6,750 | ~52% | ~21.8% | ~26% |
| 45–54 | ~$8,100 | ~54% | ~21.3% | ~24% |
| 55–64 | ~$7,200 | ~50% | ~20.9% | ~22% |
| 65+ | ~$4,900 | ~38% | ~20.1% | ~18% |
Source: Experian State of Credit 2024; Federal Reserve Survey of Consumer Finances 2022.
The 45–54 age group carries both the highest average balance (~$8,100) and the highest rate of balance-carrying (~54%). This group also shows the highest absolute interest expenditure — at 21.3% APR, the average interest cost for a revolving cardholder in this bracket exceeds $1,700 per year.
Section 5: Credit Card Debt by Income Level
Higher income does not always mean lower credit card debt. Higher-earning households often have larger absolute balances — they have access to larger credit lines and use cards for convenience, rewards, or cash-flow management. However, they also show lower utilization rates and lower rates of paying only the minimum, meaning their debt is less expensive in relative terms.
Table 4: Credit Card Debt & Income (2024)
| Income Bracket | Avg Balance | % Paying Full Monthly | % Paying Only Minimum | Avg Utilization |
|---|---|---|---|---|
| Under $30K | ~$4,100 | ~38% | ~42% | ~32% |
| $30K–$50K | ~$5,400 | ~42% | ~38% | ~30% |
| $50K–$75K | ~$6,800 | ~49% | ~32% | ~26% |
| $75K–$100K | ~$7,200 | ~54% | ~28% | ~23% |
| $100K–$150K | ~$8,500 | ~62% | ~22% | ~20% |
| $150K+ | ~$11,200 | ~71% | ~15% | ~16% |
Source: LendingTree Annual Credit Card Debt Report 2024; Consumer Financial Protection Bureau.
✅ Key Finding: The utilization rate declines consistently with income — from ~32% for the lowest bracket to ~16% for the highest. Because utilization is a primary factor in credit scoring, lower-income cardholders face a statistical double penalty: higher APR exposure and lower scores due to higher utilization, making future credit more expensive.
Section 6: The Mathematics of Revolving Debt — Worked Example
This section demonstrates how compound interest operates in reverse on debt. The formula used by credit card issuers for monthly interest is:
Monthly Interest=Average Daily Balance×APR365×Days in Billing Cycle
For simplicity in educational modeling, we use the monthly periodic rate approximation:
Monthly Rate=APR12
At 24% APR, the monthly periodic rate is 2%.
Worked Example Box: The True Cost of Minimum Payments
Scenario: $5,000 balance | 24% APR | Minimum payment = 2% of balance or $25 (whichever is greater, declining over time).
Month 1 Calculation:
- Starting Balance: $5,000
- Monthly Interest: $5,000 × 0.02 = $100
- Minimum Payment (2%): $100
- Principal Reduction: $0
If the cardholder pays exactly the minimum each month and the minimum is calculated as a declining percentage of the remaining balance (a common issuer model), the balance never reaches zero — or reaches it after an extremely long period. A more realistic model uses a fixed minimum floor (e.g., 1% of balance + interest + fees), which produces the following outcome:
| Scenario | Monthly Payment | Time to Pay Off | Total Interest Paid | Total Paid | Interest vs. Fixed |
|---|---|---|---|---|---|
| Minimum Only (2% declining) | Starts at $100, declines | ~22 years | ~$7,314 | ~$12,314 | Baseline |
| Fixed $264/month | $264 (constant) | 24 months | ~$336 | ~$5,336 | Saves ~$6,978 (95%) |
Source: CFPB Credit Card Repayment Calculator; Bankrate Payoff Calculator.
💡 Statistical Insight: Paying a fixed amount rather than the declining minimum reduces the payoff time from 22 years to 2 years — a 91% reduction in time — and eliminates approximately 95% of total interest. This demonstrates compound growth operating in reverse. For the full positive-growth analog, see the Compound Interest Statistics page, which applies the same formula to savings and investment growth.
As explained on the geometric mean page, multi-period rates of change must be calculated geometrically, not arithmetically. A 24% APR compounded monthly produces an effective annual rate of approximately 26.8%, not 24%. The geometric mean captures the true growth trajectory of debt over time.
Section 7: Total U.S. Credit Card Debt — Growth Trends
Total revolving debt has grown substantially since the 2010 deleveraging that followed the Global Financial Crisis. The COVID-19 pandemic produced a temporary collapse (as households reduced spending and used stimulus to pay down balances), followed by a rapid rebound driven by inflation, rising costs, and resumed consumption.
Table 5: Total U.S. Credit Card Debt by Year
| Year | Total Debt (Billions) | Change from Prior Year | Notable Event / Context |
|---|---|---|---|
| 2010 | ~$800B | — | Post-GFC deleveraging bottom |
| 2015 | ~$925B | +$125B | Recovery, rising employment |
| 2019 | ~$930B | +$5B | Pre-COVID plateau |
| 2020 | ~$820B | −$110B | COVID: spending drop, stimulus paydowns |
| 2021 | ~$860B | +$40B | Gradual rebound begins |
| 2022 | ~$930B | +$70B | Inflation-driven spending surge |
| 2023 | ~$1.03T | +$100B | First trillion-dollar milestone crossed |
| 2024 | ~$1.17T | +$140B | Record high; fastest annual growth in 15 years |
Source: Federal Reserve Bank of New York — Quarterly Report on Household Debt and Credit.
The ~$1.17 trillion figure in 2024 represents an increase of approximately 43% since 2020 — a rate of growth that outpaces both nominal wage growth and inflation over the same period. This divergence suggests that a growing share of household consumption is being financed through revolving credit rather than current income.
Section 8: Credit Utilization — Statistics & Impact
Credit utilization is calculated as:
Utilization Rate=Total Revolving BalancesTotal Credit Limits×100
This single metric accounts for approximately 30% of FICO credit score calculations, making it the second-most important factor after payment history.
Table 6: Credit Utilization Statistics
| Utilization Range | % of Cardholders (Est.) | Typical Score Impact | Risk Category |
|---|---|---|---|
| 0–9% | ~22% | Excellent / Optimal | Very Low Risk |
| 10–29% | ~28% | Good / Near-Optimal | Low Risk |
| 30–49% | ~23% | Fair / Declining | Moderate Risk |
| 50–69% | ~15% | Poor / Significant Drop | High Risk |
| 70%+ | ~12% | Very Poor / Severe Impact | Very High Risk |
Source: FICO Score Distribution Data; Experian 2024 State of Credit; CFPB Consumer Credit Panel.
📊 Key Finding: The impact is non-linear. Reducing utilization from 70% to 30% typically produces a larger score improvement than reducing it from 30% to 10%, because scoring models apply threshold penalties at 30%, 50%, and 70%. This is not a simple linear relationship — it resembles a step function, which differs from the continuous distributions covered in the normal distribution page. See the descriptive statistics page for how percentage-change metrics behave differently across ranges.
A critical statistical feature: utilization has no long-term memory in FICO scoring models. Paying down balances improves scores within 1–2 billing cycles — unlike missed payments, which remain on credit reports for 7 years.
Section 9: Delinquency & Default Trends
Credit card delinquency rates — defined as accounts 30 or more days past due — have normalized upward since the artificially suppressed levels of 2021–2022, when government forbearance programs temporarily masked true repayment capacity.
Table 7: Credit Card Delinquency Rates (30+ Days Past Due)
| Quarter / Year | Rate | Prior Rate | Trend Context |
|---|---|---|---|
| Q4 2021 | 1.55% | — | COVID forbearance suppresses defaults |
| Q4 2022 | 2.25% | +0.70 pp | Normalization begins |
| Q2 2023 | 2.85% | +0.60 pp | Rising inflation pressure |
| Q4 2023 | 3.15% | +0.30 pp | Pre-recession stress signals |
| Q2 2024 | 3.30% | +0.15 pp | Continued normalization |
| Q4 2024 | ~3.45% | +0.15 pp | Near historical average (~3.1%) |
Source: Federal Reserve Board — Charge-Off and Delinquency Rates; NY Fed Household Debt Report.
Subprime borrowers (FICO scores below 620) show delinquency rates approximately 3 to 4 times higher than prime borrowers (scores above 720). This disparity reflects the wide standard deviation in borrower risk profiles — a statistical spread that explains why APR ranges vary by over 15 percentage points across the same product category. See the standard deviation page for how variability in risk translates to pricing differences.
Section 10: Geographic & Demographic Variations
Credit card debt varies significantly by state and region, driven by differences in cost of living, median income, and local economic conditions.
Highest average balances (2024): Alaska ($7,300), Texas ($6,800), Colorado ($6,600), and Connecticut ($6,500).
Lowest average balances: Iowa ($4,400), Wisconsin ($4,500), North Dakota ($4,600), and West Virginia ($4,700).
These geographic differences are not random — states with higher costs of living and higher median incomes tend to have both larger absolute balances and higher available credit limits, which moderates the relative impact of any given balance.
Source: Experian 2024 State of Credit; WalletHub Annual Credit Card Debt Reports.
Section 11: Interactive Debt Payoff Calculator
💰 Credit Card Debt Repayment Calculator
Use the inputs below to model how different payment strategies affect total cost and payoff time.
Inputs:
- Current Balance ($): ______
- APR (%): ______ (use 21.5 for national average)
- Monthly Payment ($): ______ (select strategy: Minimum Only / Fixed / Aggressive)
- Payment Strategy: [Dropdown: Minimum Only (2% declining) / Fixed / Double Minimum]
Outputs (Calculated):
- Months until balance reaches $0
- Total interest paid over the life of the debt
- Total amount paid (principal + interest)
- Percentage of total payments that went to interest vs. principal
- Comparison line: “If you paid the minimum only: X years, $Y in interest”
⚠️ Calculator Disclaimer
This calculator uses compound interest with monthly compounding based on standard amortization formulas. Actual minimum payments vary by issuer (typically 1–3% of balance + fees + accrued interest). Results are mathematical estimates for educational comparison only — not personalized financial advice.
Section 12: Evidence-Based Debt Reduction Strategies
Four strategies emerge consistently from behavioral finance and credit counseling research. Each is supported by statistical evidence rather than opinion.
📉 Strategy 1: Avalanche Method (Highest Rate First)
Direct all available extra payments toward the card with the highest APR while making minimums on all others. A CFPB analysis found this method saves an average of 15–20% in total interest costs compared to distributing extra payments evenly. See the Compound Interest Statistics page for the formula that explains exactly why high-rate debt must be eliminated first: every dollar of unpaid 24% APR debt grows faster than every other household financial obligation.
❄️ Strategy 2: Snowball Method (Smallest Balance First)
Pay the smallest balance first regardless of rate. Behavioral research (Ramsey, 2014; Amar et al., 2011) shows that the psychological “win” of eliminating an account increases the probability of completing a full debt elimination program — even though it produces a higher total interest cost. The statistical trade-off is between mathematical optimization (avalanche) and behavioral completion rate (snowball).
💳 Strategy 3: Balance Transfer (0% Introductory APR)
Many issuers offer 0% APR for 12–21 months with a 3–5% transfer fee. The statistical break-even is straightforward:
- Transfer fee on $6,000: $180–$300
- Interest avoided in 12 months at 21.5% APR: ~$1,290
- Net savings (if paid within promotional period): ~$990–$1,110
The critical statistical risk: ~35% of balance-transfer users accumulate new debt on the original card, negating the benefit. This strategy works only for cardholders who close or freeze the original line and avoid new charges.
🏦 Strategy 4: Consolidation Loan (Fixed-Rate Installment)
Converting revolving debt (variable rate, open-ended, compound interest) to an installment loan (fixed rate, closed-end, amortizing) produces two statistical benefits:
- Rate reduction: Average personal loan rate (~11%) vs. average card rate (~21.5%) — nearly halves the cost of debt service.
- Structure: Fixed payments eliminate the “minimum payment trap,” where low payments extend debt for decades. See Section 6 for the 22-year vs. 2-year comparison.
Source: CFPB Debt Management Research; Journal of Financial Planning (2019); Federal Reserve Consumer Credit Data.
Section 13: Key Statistical Patterns
Five patterns stand out across the data:
Balance vs. Age: Peak debt occurs in the 45–54 age bracket, not among young adults. Young cardholders (18–34) have lower absolute balances (~$3,200) but face disproportionately high APRs (~22.1%) and high utilization (~28%).
Income Non-Linearity: Higher earners carry larger absolute balances (~$11,200 for $150K+) but maintain lower utilization (~16%) and are far less likely to pay only the minimum (~15% vs. ~42% for the lowest bracket).
APR Spread Widening: The gap between credit card APRs and the Federal Funds Rate has expanded to approximately 16 percentage points — a record spread that indicates issuers are maintaining margins regardless of monetary policy shifts.
Delinquency Normalization: After the artificial suppression of defaults during COVID forbearance (2020–2021), delinquency rates have returned to historical averages (~3.1–3.5%) by Q4 2024.
The $1.17T Milestone: For the first time in U.S. history, nominal revolving debt exceeds $1 trillion — representing approximately $3,500 per American adult, or roughly $9,200 per indebted household.
Section 14: Frequently Asked Questions
Q1: What is the average credit card balance in 2024?
The average balance per cardholder was approximately ~$6,329 [Experian 2024]. However, this figure includes accounts with zero balances. Among households that actually carry revolving debt, the average rises to approximately ~$9,200. The median balance for revolvers is lower — near ~$3,100 — because a small group of high-balance cardholders pulls the mean upward. See Table 1 and Section 2.
Q2: Why have credit card interest rates stayed so high?
Credit card APRs are variable-rate products tied to the Prime Rate (typically Fed Funds Rate + 3%). However, issuers have widened their risk premium significantly. In 2024, the average APR for balance-carrying accounts was approximately 21.5%, while the Fed Funds Rate was near 5.3% — a spread of approximately 16.2 percentage points. This spread exceeds historical norms (~12–14 pp) and reflects both higher issuer risk assessments and reduced competitive pressure in the subprime and near-prime segments.
Q3: How long does it take to pay off $5,000 in credit card debt?
With only the minimum payment (typically 2% of balance, declining), a $5,000 balance at 24% APR takes approximately 22 years to eliminate and accumulates approximately $7,314 in interest [CFPB Calculator; Bankrate]. Paying a fixed $264 per month reduces this to 24 months with only ~$336 in interest — a 91% reduction in payoff time and a 95% reduction in total interest cost. See Section 6 for the full step-by-step calculation.
Q4: What is a good credit utilization rate?
FICO scoring models apply non-linear thresholds. Below 10% is optimal; 10–29% is generally considered good; 30% is a critical threshold where scores typically begin declining; and above 50% produces significant negative impacts. Utilization has no long-term memory — reducing it improves scores within 1–2 billing cycles [FICO; Experian]. See Section 8 and Table 6.
Q5: Does paying the minimum hurt my credit score?
Paying the minimum amount on time protects your payment history (the largest scoring factor, ~35% of FICO), so it does not directly damage your score. However, carrying a balance increases your utilization rate, which accounts for approximately 30% of your score. High utilization lowers scores. Additionally, high balances with only minimum payments extend debt for decades — see Section 6 for the 22-year scenario — creating long-term financial drag without improving your credit profile.
Q6: Is credit card debt always bad?
Not necessarily. Approximately 52% of cardholders pay balances in full each month [ABA 2024] — they use cards as payment tools (for rewards, fraud protection, or cash-flow smoothing) rather than borrowing instruments. The statistical risk applies specifically to revolvers (~48%) who carry balances and pay compound interest at rates exceeding 20%. For those households, credit card debt is statistically the most expensive form of consumer credit available.
Key Terms Glossary
APR (Annual Percentage Rate): The nominal annual rate applied to carried credit card balances. At 21.5% APR, the monthly periodic rate is approximately 1.79%, and the effective annual compound rate is approximately 23.7%.
Revolving Balance: The portion of a credit card balance carried from one billing cycle to the next and subject to interest charges. Approximately 48% of American cardholders maintain revolving balances.
Minimum Payment: The lowest amount a cardholder must pay monthly to avoid late fees, typically calculated as 1–3% of the balance plus accrued interest and fees. Paying only the minimum extends debt for decades.
Credit Utilization: The ratio of total revolving balances to total available credit limits, expressed as a percentage. The primary factor (after payment history) in credit scoring models.
Compound Interest (Debt Context): Interest calculated on both the principal and accumulated unpaid interest from prior periods. At 24% APR, unpaid debt grows at an effective rate of approximately 26.8% annually when compounded monthly. See the Compound Interest Statistics page for the full formula applied to both savings and debt.
Debt Avalanche Method: Paying the highest-interest debt first while maintaining minimum payments on others. The mathematically optimal strategy for minimizing total interest cost.
Debt Snowball Method: Paying the smallest balance first regardless of interest rate. A behavioral strategy supported by research showing higher program completion rates.
Balance Transfer: Moving debt from one card to another, typically to take advantage of a temporary 0% APR promotional offer, usually with a 3–5% transfer fee.
Secured vs. Unsecured Debt: Credit cards are unsecured — not backed by collateral — which explains why their interest rates exceed secured loans (e.g., mortgages at ~7%, auto loans at ~7–10%).
Delinquency Rate: The percentage of accounts 30 or more days past due. The national credit card delinquency rate was approximately 3.45% in Q4 2024, near the historical average.
📖 Statistical Concepts Used On This Page
- Compound Interest Formula: The core mathematical mechanism driving both savings growth and debt expansion. For debt at 24% APR compounded monthly, the effective annual rate exceeds 26%. See the full formula and positive-growth examples on the Compound Interest Statistics page.
- Geometric Mean: Multi-period growth and decay rates must be averaged geometrically, not arithmetically. A 24% APR applied over 22 years produces catastrophic cumulative outcomes that arithmetic averaging understates. See the geometric mean page.
- Standard Deviation: The spread in APRs (from ~20% for prime borrowers to ~29%+ for subprime) reflects high standard deviation in borrower risk profiles. The same statistical measure explains why some cardholders pay $0 in interest (transactors) while others pay thousands. See the standard deviation page.
- Median vs. Mean: Credit card balances are strongly right-skewed. The median (
$3,100) is significantly lower than the mean ($6,329). Always prefer the median when describing “typical” values in skewed financial distributions. See the mean vs. median vs. mode page and the descriptive statistics page. - Percentage Change: Debt growth calculations (e.g., +43% from 2020 to 2024) require percentage-change formulas. Note that percentage changes in debt can exceed income growth, signaling rising leverage. See the descriptive statistics page.
- Sampling and Survey Design: Experian data covers millions of anonymized credit files; Federal Reserve G.19 aggregates issuer reports. Both are large-scale samples, not census counts. Point estimates (e.g., ~21.5% APR) include sampling variability. See the sampling distributions page for how confidence intervals apply to survey-based statistics.
- Non-Linear Threshold Effects: Credit score impacts from utilization are not linear — they accelerate at 30%, 50%, and 70% thresholds. This violates the linearity assumption of simple regression models and requires piecewise or threshold analysis. See the normal distribution page for how real-world financial data often deviates from continuous Gaussian patterns.
Data Sources & Related Articles
Primary Data Sources:
- Experian State of Credit Report 2024: National credit file statistics on balances, APRs, delinquency, and demographics. experian.com
- Federal Reserve Board — G.19 Consumer Credit: Monthly APR, total revolving credit, and charge-volume data. federalreserve.gov/releases/g19/
- Federal Reserve Bank of New York — Household Debt and Credit Report: Quarterly total debt by category, delinquency, and regional breakdowns. newyorkfed.org
- FICO Score Distribution: Credit score ranges, utilization thresholds, and scoring model documentation. fico.com
- American Bankers Association (ABA): Quarterly delinquency and charge-off surveys. aba.com
Related Articles on LearnMinto.com:
- Personal Finance Statistics: Savings, Debt & Money Habits — Broader savings and net worth context for debt analysis.
- Stock Market Statistics: Historical Returns, Volatility & Key Data — Comparative context for debt costs vs. investment returns.
Data reflects the most recently available primary-source figures as of 2025. Credit conditions, APRs, and debt levels are subject to rapid change in response to monetary policy, economic conditions, and regulatory adjustments. This page is statistical reference material for educational purposes only.