
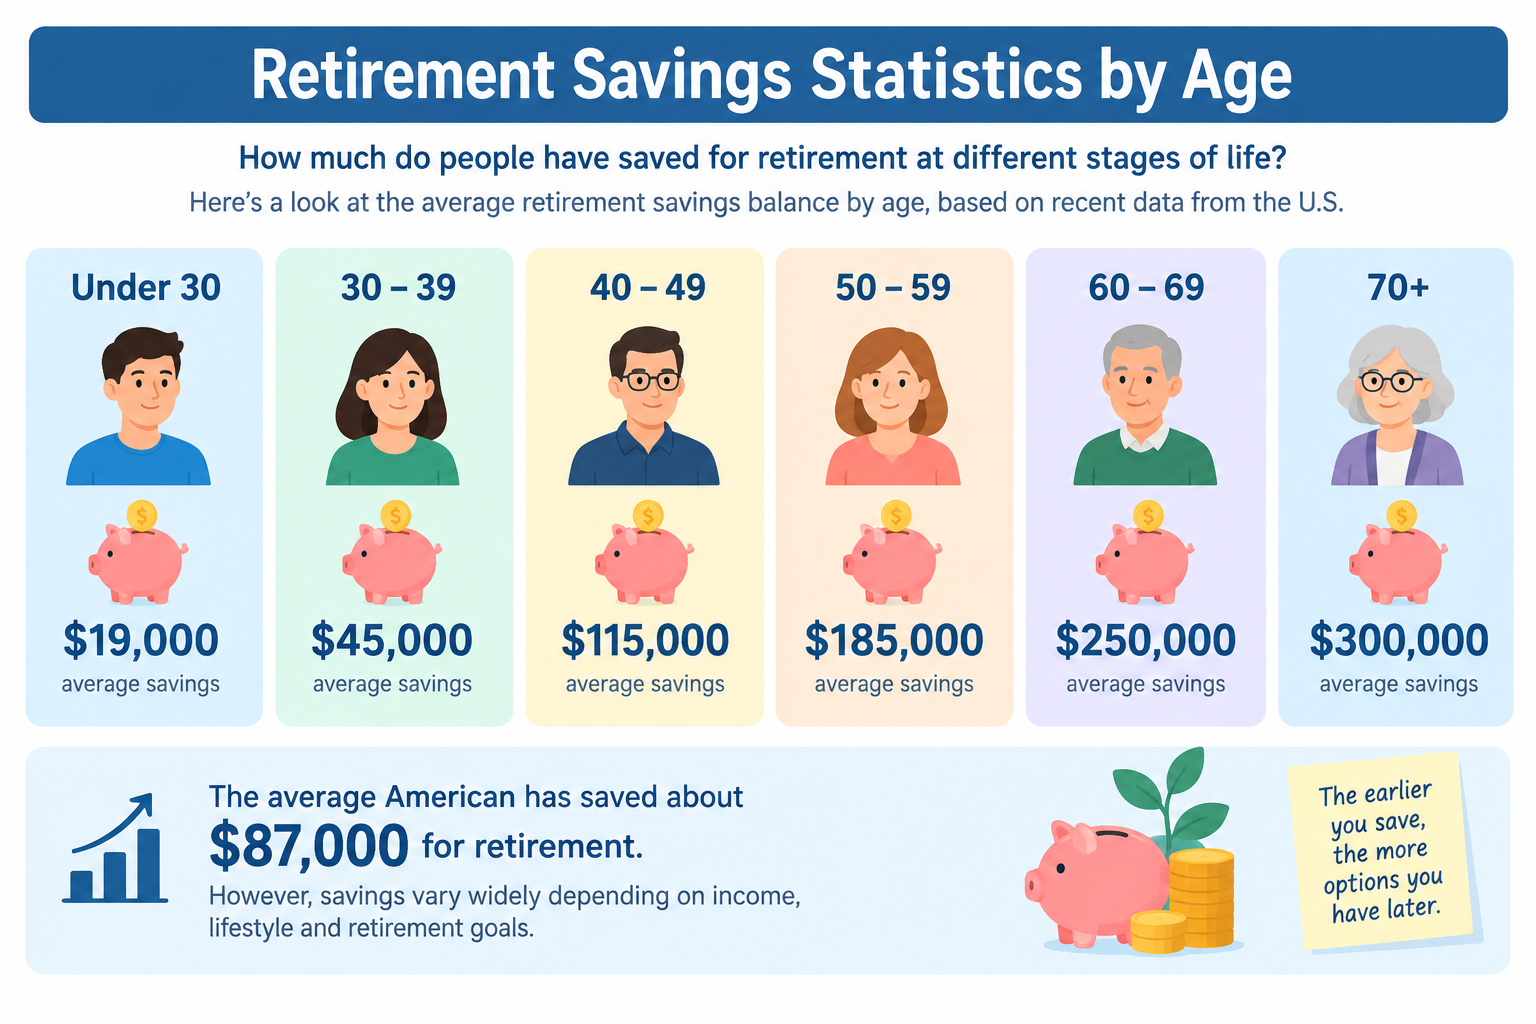
Nearly 57% of working-age Americans are financially unprepared for retirement — yet the mathematical reality is straightforward: a 25-year-old who invests $300 per month at a 7% real return will accumulate approximately $820,000 by age 65. The gap between what Americans have saved and what the compound interest formula suggests is achievable represents one of the most consequential statistical stories in personal finance.
This page compiles primary-source retirement savings statistics covering 401(k) balances, IRA data, Social Security reliance, retirement readiness benchmarks, and the mathematics of long-term compound accumulation — through 2024–2025.
What This Page Covers
✓ Average and median retirement savings by age group
✓ 401(k) and IRA balance data — national benchmarks
✓ Social Security statistics and income replacement rates
✓ Retirement readiness — how many Americans are on track
✓ Employer match statistics and participation rates
✓ Pension vs. 401(k) shift — historical data
✓ Cost of waiting — compound growth worked example
✓ Retirement income sources and monthly amounts
✓ Interactive retirement savings calculator
✓ Evidence-based retirement savings strategies
✓ Statistical concepts: compound interest, geometric mean, standard deviation
Executive Summary: Core Retirement Benchmarks
| Benchmark | Value | Context |
|---|---|---|
| 💰 | ~$87,000 | Median Retirement Savings (All Working-Age Adults) |
| 📊 | ~$333,000 | Average 401(k) Balance (All Ages, 2024) |
| ⚠️ | ~28% | Americans With Zero Retirement Savings |
| 👴 | ~90% | Retirees Relying on Social Security as Income Source |
These four numbers capture the central tension in American retirement preparedness: a large fraction of the population has saved nothing, the average is pulled upward by high-balance outliers, and Social Security — designed to replace approximately 40% of pre-retirement income — functions as the primary income source for the majority of retirees.
⚠️ Important Disclaimer
All statistics on this page are for educational purposes only. Data is sourced from government agencies, financial institutions, and academic research. This page is statistical reference material — not financial, tax, or retirement planning advice. Consult a qualified financial advisor or certified retirement planner (CRPC) for personalized guidance.
Primary sources: Federal Reserve Survey of Consumer Finances (SCF) 2022; Vanguard — How America Saves 2024; Fidelity Investments Q3 2024 Retirement Analysis; Social Security Administration Annual Statistical Supplement 2024; Employee Benefit Research Institute (EBRI) Retirement Confidence Survey 2024.
The Scale of the Retirement Savings Gap
The United States operates a three-legged stool model of retirement income: Social Security, employer-sponsored plans (401(k), pension), and personal savings. Historically, all three legs were expected to support retirees. In practice, the data shows that for a large fraction of Americans, only one leg — Social Security — is reliably present at retirement.
~28% of Americans have zero dedicated retirement savings [Federal Reserve Survey of Consumer Finances, 2022]. Among workers aged 55–64 — within 10 years of typical retirement — approximately 22% still have no retirement savings whatsoever. The median retirement account balance across all U.S. families is approximately $87,000 [Federal Reserve SCF, 2022] — but this figure, like all means and medians in wealth data, conceals enormous variation.
As discussed on the descriptive statistics page, the mean (~$333,000 for 401(k) accounts [Vanguard 2024]) exceeds the median by more than 3:1 because a small number of very high-balance accounts pull the arithmetic average far above the typical household experience. Understanding this distinction is essential: the “average” retirement saver has significantly more than the “typical” retirement saver.
✅ Key Finding: Over 20-year rolling windows, the S&P 500 has never delivered a negative inflation-adjusted return [NYU Stern Damodaran data; see Stock Market Statistics page]. The primary statistical barrier to retirement readiness is not market returns — it is the failure to begin compounding early and consistently.
Retirement Savings by Age — The Core Benchmark Data
The Federal Reserve’s Survey of Consumer Finances (conducted every three years) and Fidelity Investments’ quarterly retirement analysis provide the two most comprehensive datasets on retirement account balances. Both use different methodologies — the SCF surveys household wealth broadly; Fidelity analyzes its own ~45 million account holders.
Fidelity’s Savings Benchmarks
Fidelity recommends the following retirement savings milestones, expressed as multiples of annual salary:
| Age | Recommended Savings (× Salary) | Example (Median $59K Salary) |
|---|---|---|
| 30 | 1× | ~$59,000 |
| 35 | 2× | ~$118,000 |
| 40 | 3× | ~$177,000 |
| 45 | 4× | ~$236,000 |
| 50 | 6× | ~$354,000 |
| 55 | 7× | ~$413,000 |
| 60 | 8× | ~$472,000 |
| 67 | 10× | ~$590,000 |
Source: Fidelity Investments Retirement Savings Guidelines (2024). Based on median U.S. individual income of approximately $59,000 [Bureau of Labor Statistics, 2024].
Table 1: Average and Median Retirement Savings by Age Group (2024)
| Age Group | Avg 401(k) Balance | Median 401(k) Balance | Fidelity Target | Gap (Median vs. Target) | % With Zero Retirement Savings |
|---|---|---|---|---|---|
| 20s | ~$15,400 | ~$6,100 | ~$20,000 (1× salary) | −$13,900 | ~41% |
| 30s | ~$51,800 | ~$22,100 | ~$90,000 (2× salary est.) | −$67,900 | ~34% |
| 40s | ~$106,000 | ~$48,000 | ~$200,000 (3–4× salary) | −$152,000 | ~29% |
| 50s | ~$199,000 | ~$87,000 | ~$350,000 (6–7× salary) | −$263,000 | ~25% |
| 60s | ~$272,000 | ~$112,000 | ~$500,000+ (8–10× salary) | −$388,000 | ~22% |
Source: Vanguard — How America Saves 2024; Fidelity Investments Q3 2024 Retirement Analysis; Federal Reserve Survey of Consumer Finances 2022.
The gap column is the most statistically significant feature of this table. At every age group, the median balance falls far below the Fidelity benchmark — with the largest absolute gap occurring in the 60s age group, where the median holder is approximately $388,000 short of the recommended accumulation target.
The mean vs. median divergence at each age illustrates positive skew: high-balance accounts (often belonging to high-income earners, long-tenured employees, or those who inherited wealth) inflate the arithmetic average. See the mean vs. median page and the descriptive statistics guide for a full mathematical explanation of why this gap exists and what it implies for population-level analysis.
401(k) Statistics — Participation, Contribution, and Match Rates
The 401(k) is the dominant employer-sponsored retirement vehicle for private-sector workers. Understanding its statistical parameters — contribution rates, employer match, and participation — reveals why outcomes vary so dramatically across the working population.
Table 2: 401(k) Key Statistics (2024)
| Metric | Value | Source | Note |
|---|---|---|---|
| % of private-sector workers with 401(k) access | ~57% | BLS National Compensation Survey | Does not include government/pension workers |
| % of eligible workers who participate | ~79% | Vanguard How America Saves 2024 | Auto-enrollment increases this significantly |
| Average employee contribution rate | ~7.4% of salary | Vanguard 2024 | Below recommended 10–15% |
| Average employer match rate | ~4.3% of salary | Vanguard 2024 | Effectively a 100% return on matched dollars |
| % of workers receiving full employer match | ~55% | EBRI 2024 | ~45% leave match money on the table |
| 2024 IRS contribution limit (under 50) | $23,000 | IRS Notice 2023-75 | Maximum pre-tax deferral |
| 2024 IRS catch-up limit (50 and older) | $30,500 | IRS Notice 2023-75 | Additional $7,500 allowed |
| Average 401(k) balance (all accounts, 2024) | ~$333,000 | Fidelity Q3 2024 | Mean; median is significantly lower |
| Median 401(k) balance (all accounts, 2024) | ~$87,000 | Federal Reserve SCF 2022 | More representative of typical saver |
Source: Vanguard — How America Saves 2024; Fidelity Investments Q3 2024; Bureau of Labor Statistics National Compensation Survey; IRS; Federal Reserve SCF 2022.
The Employer Match — Statistical Significance
An employer match of 4.3% on a $59,000 salary equals approximately $2,537 per year in free compensation. Workers who do not contribute enough to capture the full match are forfeiting this amount annually. Over a 30-year career, at 7% annual growth, that uncaptured match compounds to approximately:
$2,537 × [(1.07^30 − 1) / 0.07] ≈ $241,000
Approximately 45% of workers with 401(k) access do not contribute enough to capture the full employer match [EBRI 2024] — leaving an estimated $24 billion annually in unmatched contributions unclaimed [Vanguard research estimate].
IRA Statistics — Traditional and Roth
Individual Retirement Accounts (IRAs) supplement employer plans for workers without access and provide additional savings capacity for those with 401(k) plans.
Table 3: IRA Statistics (2024)
| Metric | Traditional IRA | Roth IRA | Note |
|---|---|---|---|
| Total accounts held (U.S.) | ~37 million | ~31 million | Many investors hold both |
| Total assets | ~$12.0 trillion | ~$1.5 trillion | Traditional dominates by historical rollover volume |
| Average account balance | ~$124,000 | ~$39,000 | Roth accounts are newer; average ages lower |
| 2024 contribution limit | $7,000 | $7,000 (income-limited) | Shared limit across all IRAs |
| Catch-up contribution (50+) | $8,000 | $8,000 | Additional $1,000 allowed |
| % of Americans contributing annually | ~17% | ~22% | Low annual participation relative to eligibility |
| Income limit for Roth (Single filers) | N/A | $161,000 phase-out | High earners ineligible for direct Roth |
Source: Investment Company Institute (ICI) — IRA Ownership Survey 2024; IRS Retirement Plan Limits; Federal Reserve SCF 2022.
Social Security Statistics
Social Security provides the statistical foundation of retirement income for the majority of American retirees — yet it was designed to supplement, not replace, private savings. Understanding its actual income replacement rate is essential for retirement planning accuracy.
Table 4: Social Security Key Statistics (2024)
| Metric | Value | Source |
|---|---|---|
| Average monthly benefit (all retired workers) | ~$1,907 | SSA Annual Statistical Supplement 2024 |
| Maximum monthly benefit (Full Retirement Age) | ~$3,822 | SSA 2024 |
| Maximum monthly benefit (Age 70) | ~$4,873 | SSA 2024 |
| % of retirees receiving Social Security | ~90% | SSA 2024 |
| % of retirees depending on SS for 90%+ of income | ~40% | SSA 2024 |
| % of retirees depending on SS for 50%+ of income | ~65% | SSA 2024 |
| Income replacement rate (Average earner) | ~40% of pre-retirement income | SSA actuarial estimates |
| Full Retirement Age (FRA) for born 1960+) | 67 years | Social Security Act |
| Break-even age for delaying to 70 vs. 62 | ~80–82 years | SSA actuarial tables |
Source: Social Security Administration — Annual Statistical Supplement 2024; SSA Office of the Chief Actuary.
The 40% income replacement rate at the average wage level is the most critical number in this table. Financial planners typically target 70–80% income replacement in retirement. The gap — approximately 30–40 percentage points — is what private savings (401(k), IRA, pension) must fill. For a worker earning $59,000 annually, this gap equals approximately $17,700–$23,600 per year that Social Security does not cover.
Delaying Social Security from age 62 to 70 increases the monthly benefit by approximately 77% [SSA]. However, the break-even age — the point at which the total cumulative benefit from delayed claiming exceeds that from early claiming — is approximately 80–82 years. Whether delay is statistically optimal depends on life expectancy, health, and the opportunity cost of alternative investments.
The Pension-to-401(k) Shift — Historical Data
One of the most consequential structural changes in American retirement over the past 40 years has been the shift from defined benefit (pension) plans to defined contribution (401(k)) plans. This shift transferred investment risk from employers to employees.
Table 5: Defined Benefit vs. Defined Contribution — Historical Shift
| Year | % of Private Workers With Defined Benefit (Pension) | % With Defined Contribution (401k/DC) | % With Both or Neither |
|---|---|---|---|
| 1975 | ~88% | ~12% | Small overlap |
| 1985 | ~70% | ~40% | Growing DC adoption |
| 1995 | ~55% | ~57% | Crossover point |
| 2005 | ~33% | ~66% | DB in significant decline |
| 2015 | ~17% | ~75% | DC dominant |
| 2024 | ~13% | ~79% | Pension now rare in private sector |
Source: Bureau of Labor Statistics — National Compensation Survey; Department of Labor Employee Benefits Survey; EBRI Databook on Employee Benefits.
The statistical implication of this shift is significant: defined benefit plans provided predictable, lifetime income with investment risk borne by the employer. Defined contribution plans provide variable, accumulation-based balances with investment risk borne entirely by the employee. The shift from certainty to variability — from defined outcome to defined contribution — is one reason that retirement savings standard deviation across the population has increased dramatically since 1975. For the mathematical treatment of variability in savings outcomes, see the standard deviation page.
Retirement Income Sources — Current Retiree Data
Table 6: Retirement Income Sources (2024)
| Income Source | % of Retirees Relying On It | Avg Monthly Amount | % Relying As Primary Source |
|---|---|---|---|
| Social Security | ~90% | ~$1,907 | ~65% |
| 401(k) / IRA Withdrawals | ~42% | ~$1,200–$2,500 | ~15% |
| Defined Benefit Pension | ~22% | ~$1,550 | ~12% |
| Part-Time Employment | ~27% | ~$800 | ~5% |
| Investment Income (Non-Retirement) | ~18% | ~$950 | ~2% |
| Family / Spousal Support | ~8% | ~$450 | ~1% |
Source: Social Security Administration Annual Statistical Supplement 2024; Employee Benefit Research Institute Retirement Confidence Survey 2024; Federal Reserve Survey of Consumer Finances 2022.
The dominance of Social Security as both a near-universal source (~90% reliance) and primary source (~65%) confirms that private retirement savings, while statistically important, have not replaced government benefits as the foundation of retirement income — despite 40 years of 401(k) growth.
The Cost of Waiting — Compound Growth Worked Example
This section demonstrates mathematically why starting retirement savings early is the single most statistically powerful decision a young worker can make. The principle is compound growth — the same mathematical mechanism analyzed in detail on the Compound Interest Statistics page.
The Compound Growth Formula Applied to Retirement
FV = P(1 + r)^t + PMT × [(1 + r)^t − 1] / r
Where:
- FV = Future Value (retirement balance)
- P = Current savings (initial balance)
- r = Annual return rate
- t = Years until retirement
- PMT = Annual contribution
Worked Example: The Cost of a 10-Year Delay
Assumptions: $300/month contribution | 7% annual return (approximate long-run real return) | Retirement at age 67
Scenario A — Start at Age 25:
- Contributing period: 42 years
- Total contributions: $300 × 12 × 42 = $151,200
- Future value at 67:
FV = $300 × 12 × [(1.07^42 − 1) / 0.07] ≈ $820,000
Scenario B — Start at Age 35:
- Contributing period: 32 years
- Total contributions: $300 × 12 × 32 = $115,200
- Future value at 67:
FV = $300 × 12 × [(1.07^32 − 1) / 0.07] ≈ $406,000
Scenario C — Start at Age 45:
- Contributing period: 22 years
- Total contributions: $300 × 12 × 22 = $79,200
- Future value at 67:
FV = $300 × 12 × [(1.07^22 − 1) / 0.07] ≈ $175,000
Statistical Summary: The Cost of Delay
| Start Age | Total Contributions | Value at 67 | Growth from Compounding | Delay Cost vs. Age 25 |
|---|---|---|---|---|
| Age 25 | $151,200 | ~$820,000 | ~$668,800 | — |
| Age 35 | $115,200 | ~$406,000 | ~$290,800 | −$414,000 |
| Age 45 | $79,200 | ~$175,000 | ~$95,800 | −$645,000 |
The 10-year delay from age 25 to age 35 — with identical monthly contributions — produces approximately $414,000 less in final wealth. The delay from 25 to 45 costs approximately $645,000. These differences arise entirely from compound growth applied over different time horizons: the formula is the same, but the exponent (t) changes dramatically.
As explained on the geometric mean page, the geometric mean annual return — not the arithmetic average — is the correct measure of compound growth. A 7% geometric mean means the portfolio multiplies by a factor of (1.07)^t — an exponential function where t dominates over long periods.
Retirement Readiness Statistics — Are Americans On Track?
Table 7: Retirement Readiness by Age and Income (2024)
| Group | % “On Track” for Retirement | Definition Used | Primary Gap Driver |
|---|---|---|---|
| All working-age Americans | ~43% | Fidelity 10× final salary at 67 | Low savings rates + late starts |
| Ages 22–35 | ~38% | 1–2× salary by 35 | Non-participation; student debt priority |
| Ages 36–50 | ~41% | 3–6× salary | Insufficient contribution rates |
| Ages 51–65 | ~45% | 7–10× salary | Catch-up contributions underutilized |
| Income Under $40K | ~22% | Any measurable progress | No employer plan access; cash flow |
| Income $40K–$100K | ~44% | Fidelity benchmarks | Moderate savings; housing costs |
| Income $100K+ | ~68% | Fidelity benchmarks | Higher savings rates; employer match |
Source: Fidelity Investments Retirement Preparedness Study 2024; Employee Benefit Research Institute Retirement Confidence Survey 2024; Vanguard How America Saves 2024.
Only 43% of working-age Americans are statistically on track to meet recommended retirement savings benchmarks [Fidelity 2024]. The readiness gap is not uniform: lower-income workers face structural barriers (no employer plan access, insufficient discretionary income), while middle-income workers often face behavioral barriers (insufficient contribution rates, early withdrawals).
Early Withdrawal Statistics — The Hidden Cost
Approximately 40% of workers cash out their 401(k) when changing jobs rather than rolling the balance into a new plan or IRA [Vanguard; EBRI]. This behavior is statistically costly in two ways:
1. Immediate tax + penalty cost: Early withdrawal (before age 59½) triggers ordinary income tax plus a 10% penalty. On a $15,000 balance, the net cost is approximately $3,750–$5,250 (depending on marginal rate) — an immediate 25–35% wealth destruction.
2. Lost compound growth: The $15,000 that is withdrawn rather than retained in a tax-advantaged account, if left to compound at 7% for 25 years, would grow to approximately:
$15,000 × (1.07)^25 ≈ $81,400
The total cost of a single early withdrawal — immediate taxes/penalty plus lost compound growth — is therefore approximately $66,000–$70,000 on a $15,000 balance. See the Compound Interest Statistics page for the full exponential growth formula applied to retirement balances.
Interactive Retirement Savings Calculator
📈 Retirement Savings Growth Calculator
This calculator applies the compound growth formula to model retirement accumulation under different savings rates and timelines.
Inputs:
- Current Age: __________
- Retirement Age: __________ (default: 67)
- Current Retirement Savings ($): __________
- Monthly Contribution ($): __________
- Expected Annual Return (%): __________ (default: 7%)
- Employer Match (%): __________ (default: 4%)
Outputs (Calculated):
- Projected retirement balance at target age
- Total personal contributions
- Total employer match contributed
- Total growth from compounding (interest/return)
- Balance vs. Fidelity benchmark (gap or surplus)
- Comparison line: “If you increase contribution by $100/month: +$X,XXX at retirement”
Evidence-Based Retirement Savings Strategies
🏦 Strategy 1: Capture the Full Employer Match First
Definition: Contribute at minimum enough to receive the full employer match before directing money anywhere else.
Statistical backing: The employer match is a 100% instant return on matched dollars — no investment vehicle, including equities, provides a guaranteed return of this magnitude. A worker earning $59,000 with a 4% match who does not contribute enough to capture it forfeits approximately $2,360 annually. Over 30 years at 7%, this equals approximately $224,000 in lost wealth [Vanguard research]. Approximately 45% of eligible workers fail to capture the full match [EBRI 2024].
⏰ Strategy 2: Start Early and Increase Contributions Gradually
Definition: Begin contributing at the earliest opportunity and use automatic escalation (typically 1% increase annually) to gradually reach target rates.
Statistical backing: As shown in the worked example above, starting at age 25 vs. 35 produces approximately $414,000 more in retirement wealth with identical monthly contributions. Vanguard’s behavioral research found that automatic escalation programs — which increase contributions by 1% annually — increased average savings rates from 6.8% to 10.4% over four years without producing measurable increases in opt-out rates.
📊 Strategy 3: Maintain a Diversified, Low-Cost Portfolio
Definition: Allocate retirement assets across broad-market index funds with minimal expense ratios; rebalance annually.
Statistical backing: The S&P Global SPIVA Scorecard consistently finds that approximately 80–90% of active large-cap funds underperform the S&P 500 over 15-year periods after fees [SPIVA 2024; see Stock Market Statistics page]. A 1% annual fee difference on a $200,000 retirement account compounding at 7% over 20 years reduces the final balance by approximately $120,000. Vanguard research shows systematic annual rebalancing adds approximately 0.3–0.5% in annualized return at lower portfolio volatility.
🚫 Strategy 4: Avoid Early Withdrawals and Loans
Definition: Keep retirement funds intact through job changes and financial disruptions — roll over 401(k) balances rather than cashing out.
Statistical backing: As calculated above, a single $15,000 early withdrawal costs approximately $66,000–$70,000 in total wealth (taxes, penalties, and lost compound growth). Workers who cash out 401(k) balances at job separation — approximately 40% of departing employees [Vanguard] — experience permanently lower retirement outcomes. The CFPB notes that 401(k) loans, while not subject to immediate penalty, reduce invested balances and disrupt compound accumulation during the repayment period.
Key Patterns From the Retirement Data
Pattern 1 — The Median-Mean Gap Persists at Every Age
At every age group in Table 1, the mean 401(k) balance is 2–3 times the median. This right-skew is driven by a small fraction of very high-balance accounts. Statistical analyses of retirement preparedness that report only mean balances systematically overstate the typical household’s position.
Pattern 2 — Non-Participation Is the Primary Driver of the Gap
Approximately 28% of working-age Americans have zero retirement savings. Among the remaining 72% who do save, the median contribution rate of approximately ~7.4% is below the 10–15% target most financial researchers recommend. The savings gap is therefore partly a participation problem and partly an insufficient contribution rate problem.
Pattern 3 — Social Security Dependency Has Not Declined
Despite 40 years of 401(k) growth, approximately 65% of retirees still rely on Social Security as their primary income source [SSA 2024]. The shift from defined benefit to defined contribution plans transferred risk to employees without producing a commensurate increase in private savings rates.
Pattern 4 — The Delay Penalty Is Exponential, Not Linear
The worked example demonstrates that the cost of a 10-year delay (~$414,000) is not proportional to the contributions missed — it is amplified by lost compound growth. This non-linearity is the central mathematical argument for early enrollment, and it is directly derived from the exponential nature of the compound growth formula.
Pattern 5 — Income Access to 401(k) Is Unequal
Only approximately 57% of private-sector workers have access to a 401(k) plan at their current employer [BLS National Compensation Survey 2024]. Low-wage and part-time workers are disproportionately excluded from employer-sponsored plans — the structural mechanism that most effectively drives retirement saving through automatic payroll deduction and employer matching.
Frequently Asked Questions
Q1: How much does the average American have saved for retirement?
The mean 401(k) balance across all Fidelity account holders is approximately $333,000 [Fidelity Q3 2024]. The median retirement savings across all U.S. families is approximately $87,000 [Federal Reserve SCF 2022]. The large gap between mean and median reflects positive skew — high-balance accounts pull the arithmetic average far above the typical saver’s experience. Approximately 28% of working-age Americans have zero dedicated retirement savings.
Q2: How much should I have saved by age 50?
Fidelity’s benchmark recommends 6× your annual salary saved by age 50. For the median U.S. worker earning approximately $59,000, that implies approximately $354,000 in retirement accounts by age 50. The median retirement balance for Americans in their 50s is approximately $87,000 — approximately $267,000 below this benchmark. Catch-up contributions (an additional $7,500 annually for those 50+) are specifically designed to help address this gap.
Q3: Is Social Security enough to retire on?
For most workers, Social Security alone is not sufficient for retirement income maintenance. The average Social Security benefit is approximately $1,907/month (~$22,884/year) [SSA 2024], replacing approximately 40% of the average pre-retirement income. Financial planning research generally targets 70–80% income replacement — a gap of approximately 30–40 percentage points that private savings must fill. The gap in dollar terms for a median-income worker is approximately $17,700–$23,600 annually.
Q4: What is a 401(k) employer match and why does it matter?
An employer match is additional compensation contributed to your 401(k) by your employer, typically expressed as a percentage of your contribution up to a salary cap. The average employer match is approximately 4.3% of salary [Vanguard 2024]. Because the match is a 100% instant return on matched dollars, it is statistically the highest-priority retirement savings action available to most workers. Approximately 45% of eligible workers do not contribute enough to capture the full match, forfeiting an average of approximately $2,537/year in free compensation.
Q5: When should I start saving for retirement?
The compound growth worked example on this page demonstrates that starting at age 25 vs. age 35 with identical $300/month contributions produces approximately $414,000 more in retirement wealth at age 67 — with only $36,000 more in total contributions. The additional wealth comes entirely from compound growth over the extra 10 years. The statistical answer is: the optimal time to start is as early as possible, and the second-optimal time is immediately.
Q6: What happens to my 401(k) when I change jobs?
Workers have three options: roll over the balance to a new employer’s plan or an IRA (no taxes or penalties), leave it with the former employer (if the plan allows), or cash it out (subject to income tax plus a 10% early withdrawal penalty before age 59½). Approximately 40% of workers cash out their 401(k) at job separation [Vanguard; EBRI] — a decision that triggers immediate tax costs and permanently disrupts compound accumulation. Rolling over to an IRA preserves the full tax-advantaged balance.
Key Terms Glossary
401(k)
An employer-sponsored defined contribution retirement plan allowing pre-tax (traditional) or post-tax (Roth) salary deferrals. The 2024 contribution limit is $23,000 ($30,500 for those 50+). Employer matching contributions are excluded from the employee limit.
IRA (Individual Retirement Account)
A personal retirement savings account with tax advantages, available in Traditional (pre-tax contributions, taxable withdrawals) and Roth (post-tax contributions, tax-free withdrawals) versions. The 2024 combined contribution limit is $7,000 ($8,000 for those 50+).
Defined Benefit Plan (Pension)
An employer-sponsored retirement plan that guarantees a specific monthly income in retirement based on years of service and final salary. Investment risk is borne by the employer. Now rare in the private sector.
Defined Contribution Plan
A retirement plan where the employee, employer, or both make contributions to an individual account. The final retirement income depends on accumulated contributions and investment returns. Investment risk is borne by the employee.
Social Security Full Retirement Age (FRA)
The age at which a worker born in 1960 or later qualifies for 100% of their Social Security benefit — currently 67. Claiming before 67 permanently reduces benefits; delaying beyond 67 (up to 70) increases them by approximately 8% per year.
Compound Growth (Retirement Context)
The exponential accumulation of investment returns on both principal and previously earned returns. The formula FV = PMT × [(1+r)^t − 1] / r demonstrates why time (t) is the dominant variable in retirement accumulation. See the Compound Interest Statistics page.
Required Minimum Distribution (RMD)
The minimum amount the IRS requires traditional IRA and 401(k) holders to withdraw annually beginning at age 73 (as of SECURE 2.0 Act, 2023). Failure to take RMDs triggers a 25% excise tax on the shortfall.
Catch-Up Contribution
An additional IRS-authorized contribution allowed for workers aged 50 and older. In 2024: $7,500 extra for 401(k) plans; $1,000 extra for IRAs. Allows late starters to accelerate accumulation.
Sequence of Returns Risk
The statistical risk that poor investment returns early in retirement — when withdrawals are being made — permanently reduce portfolio longevity compared to the same average returns occurring in a different order. This is a key reason why portfolio allocation matters at retirement, not just during accumulation.
Income Replacement Rate
The percentage of pre-retirement income maintained through retirement income sources. Financial planners typically target 70–80%. Social Security provides approximately 40% for the average earner — leaving a substantial gap for private savings to fill.
Statistical Concepts Used On This Page
Compound Interest / Geometric Growth: The retirement savings formula FV = PMT × [(1+r)^t − 1] / r demonstrates exponential accumulation. The 10-year delay example shows how (1.07)^42 vs. (1.07)^32 produces a $414,000 gap from the same monthly contribution. See the Compound Interest Statistics page for the full derivation of both growth and annuity formulas.
Geometric Mean: The correct measure of average compound investment return. A 7% geometric mean annual return means the portfolio multiplies by exactly (1.07)^t — not the arithmetic average of yearly returns. See the geometric mean page for proof that geometric mean ≤ arithmetic mean when variance > 0.
Median vs. Mean: The gap between mean 401(k) balance ($333,000) and median ($87,000) is a textbook example of positive skew in financial data. Using only the mean overstates the typical saver’s position. See the mean vs. median page and the descriptive statistics guide.
Standard Deviation: Retirement savings balances have extremely high standard deviation because the distribution runs from $0 (28% of the population) to several million dollars (high earners).