
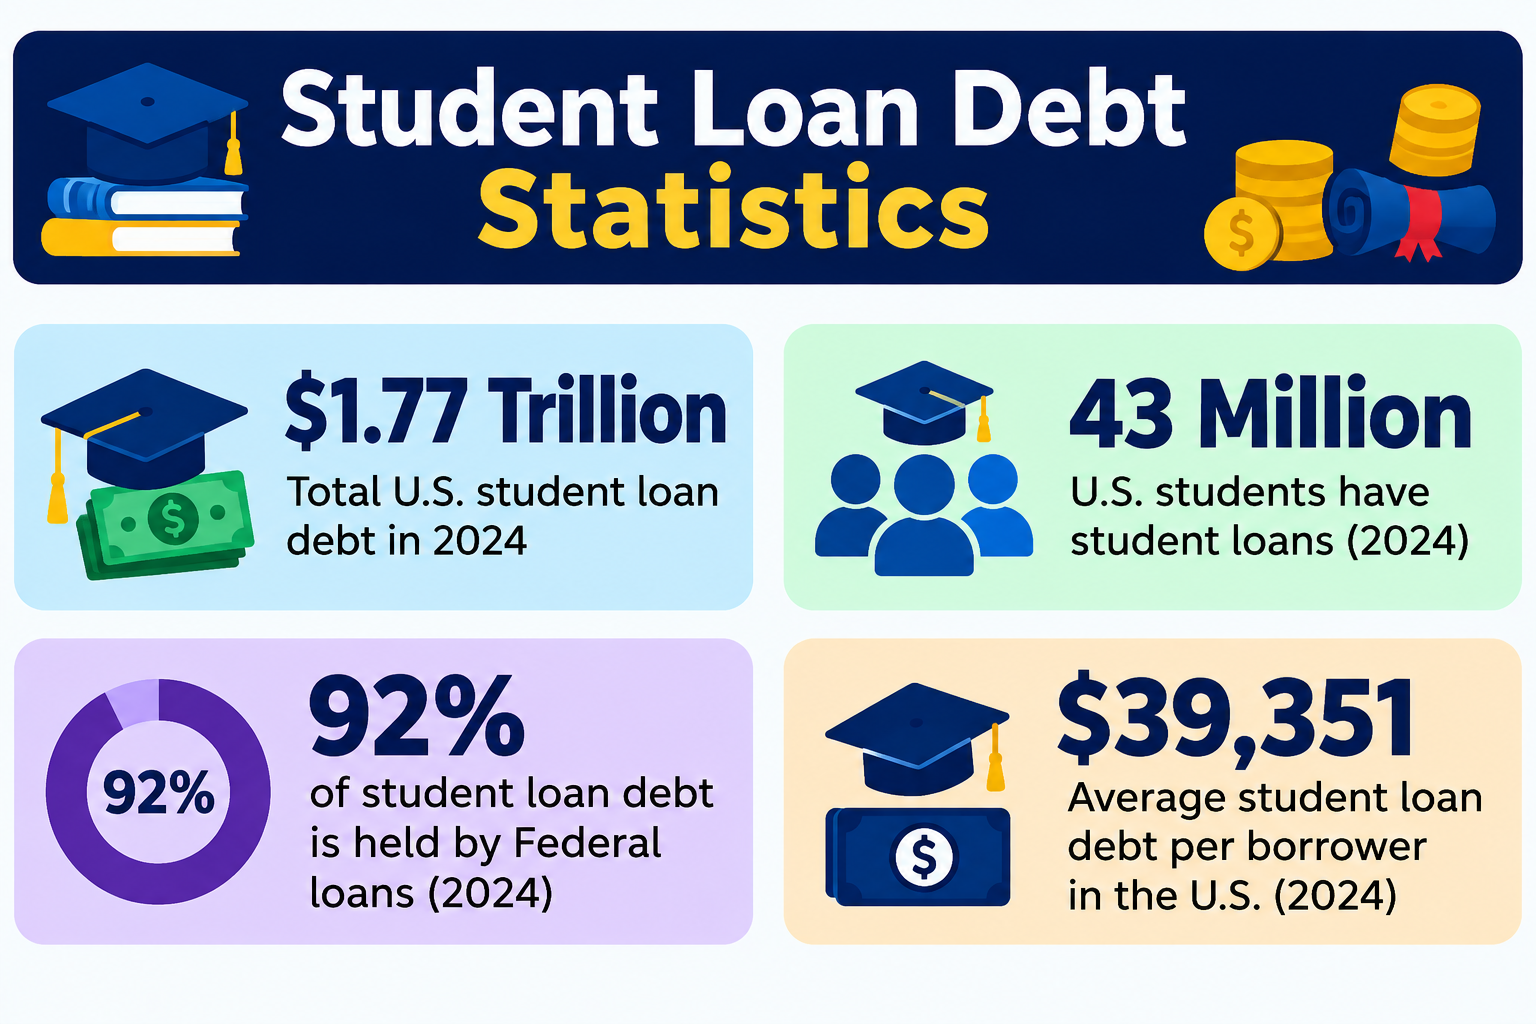
A $37,000 federal student loan borrowed at 5.5% interest and repaid over 10 years costs approximately $11,500 in total interest — meaning nearly one-third of every dollar paid goes not to education, but to compound interest accumulation. Across approximately 43 million borrowers, that arithmetic produces a national debt burden exceeding $1.75 trillion.
This page compiles primary-source student loan statistics covering total debt volume, borrower demographics, default and delinquency trends, repayment timelines, and the mathematical cost of education debt — through 2024–2025.
What This Page Covers
✓ Total U.S. student loan debt and annual growth
✓ Average borrower balance and debt by degree type
✓ Federal vs. private loan statistics
✓ Student loan debt by age, race, and income
✓ Default and delinquency rates — historical trends
✓ Repayment plan statistics (Standard, IBR, SAVE, etc.)
✓ Cost of interest — worked compound-interest example
✓ Forgiveness and cancellation data
✓ Interactive loan repayment calculator
✓ Evidence-based debt management strategies
✓ Statistical concepts: compound interest, geometric mean, standard deviation, sampling
Executive Summary: The Scale of Education Debt
| Benchmark | Value | Source / Period |
|---|---|---|
| ~$1.75 Trillion | Total U.S. Student Loan Debt | NY Fed / DoE (2024) |
| ~$37,850 | Average Borrower Balance | DoE NSLDS (2024 est.) |
| ~8% | Borrowers With $100K+ Debt | Graduate / Professional |
| ~10–15% | Federal Cohort Default (3-Year) | DoE Cohort Data |
Student loans are the second-largest category of household debt after mortgages — and unlike mortgage debt, they are unsecured, rarely dischargeable in bankruptcy, and carry fixed rates that compound monthly over repayment terms. Because repayment spans 10 to 30 years for many borrowers, the statistical interaction between compound interest, time, and principal produces outcomes that arithmetic intuition consistently underestimates.
⚠️ Important Disclaimer
All statistics on this page are for educational purposes only. Data is sourced from government and institutional reports. This page is statistical reference material — not legal, tax, or student loan counseling advice. Consult the Department of Education or a qualified nonprofit counselor for personalized repayment guidance.
Primary sources: U.S. Department of Education — Federal Student Aid (studentaid.gov); Federal Reserve Bank of New York Quarterly Household Debt and Credit Report; College Board Trends in Student Aid; Institute for College Access & Success (TICAS).
Section 1: Executive Summary & The Scale of Education Debt
The ~$1.75 trillion figure covers both federal (~92%) and private (~8%) student loans held by approximately 43 million borrowers. Unlike revolving credit card debt, which is open-ended, student loans are typically amortizing installment debt — meaning each payment covers both principal and accrued interest according to a fixed schedule. This structure means the cost of borrowing depends critically on the interest rate, the repayment term, and whether payments are interrupted.
For a borrower with the national average balance of ~$37,850 at the current federal undergraduate rate of approximately 5.5%, extending repayment from 10 years to 25 years increases total interest from approximately $11,100 to over $31,000 — nearly tripling the cost of the original education. See Section 9 for the full step-by-step calculation.
Section 2: Total U.S. Student Loan Debt — Volume & Growth
Federal student loans dominate the market (~92% of total volume) and are issued through the William D. Ford Direct Loan Program. Private loans (~8%) are issued by banks and credit unions, typically require credit checks or co-signers, and often carry variable rates that exceed federal fixed rates.
Table 1: Total Student Loan Debt by Year
| Year | Federal (Billions) | Private (Billions) | Total (Billions) | % Change | Borrowers (Millions) |
|---|---|---|---|---|---|
| 2010 | ~$700B | ~$60B | ~$760B | — | ~37M |
| 2015 | ~$1,150B | ~$90B | ~$1.24T | +63% | ~43M |
| 2019 | ~$1,420B | ~$90B | ~$1.51T | +22% | ~44M |
| 2020 | ~$1,480B | ~$85B | ~$1.57T | +4% | ~43M |
| 2022 | ~$1,640B | ~$130B | ~$1.76T | +12% | ~43M |
| 2024 | ~$1,600B* | ~$150B* | ~$1.75T | −0.5% | ~43M |
*2024 federal figure reflects forgiveness and cancellation adjustments; private figure continues gradual growth.
Source: Federal Reserve Bank of New York Quarterly Household Debt Report; Department of Education National Student Loan Data System (NSLDS); College Board Trends in Student Aid 2024.
The slight decline in 2024 from the 2022 peak reflects approximately $175 billion in forgiveness and cancellation through Public Service Loan Forgiveness (PSLF), SAVE plan adjustments, and borrower defense discharges — not a reduction in new borrowing, which continues at approximately $90–$100 billion annually.
Section 3: Average Borrower Balance — By Degree & Program
National averages are strongly right-skewed by graduate and professional borrowers. The mean balance ($37,850) exceeds the median ($20,000) by nearly 2×, a textbook case of positive skew. A small percentage of borrowers with professional degrees (Law, Medicine, Dental) hold balances exceeding $150,000–$250,000, pulling the arithmetic mean upward. See the descriptive statistics page and the mean vs. median vs. mode page for why this gap requires median interpretation when describing the “typical” borrower.
Table 2: Average Debt at Graduation (Most Recent Cohort)
| Degree Type | Avg Debt | Median Debt | % Borrowing | Notes |
|---|---|---|---|---|
| Bachelor’s (Public 4-Yr) | ~$27,000 | ~$20,000 | ~55% | State funding reduces borrowing |
| Bachelor’s (Private) | ~$32,000 | ~$26,000 | ~65% | Higher tuition drives debt |
| Associate (Public 2-Yr) | ~$16,000 | ~$10,000 | ~35% | Lower tuition, lower borrowing rate |
| Master’s | ~$46,000 | ~$38,000 | ~55% | Often requires additional borrowing |
| Doctoral (Ph.D.) | ~$80,000+ | ~$55,000 | ~60% | Longer time-to-degree |
| Professional (Law/Med/Dental) | ~$150,000–$200,000+ | ~$140,000 | ~70–85% | Drives national mean upward |
Source: College Board Trends in Student Aid 2024; Institute for College Access & Success (TICAS) — Project on Student Debt 2024; Department of Education NSLDS.
Because professional-degree borrowers represent a small share of all borrowers (~6–8%) but hold disproportionately large balances, they account for a substantial portion of the $1.75 trillion total despite being a statistical minority.
Section 4: Federal vs. Private Loans — Statistical Comparison
Federal loans offer fixed rates, income-driven repayment options, and forgiveness pathways. Private loans typically require co-signers (~85% of private loans have one) and lack the flexible repayment structures that reduce default risk.
Table 3: Federal vs. Private Loan Statistics (2024)
| Metric | Federal | Private | Note |
|---|---|---|---|
| % of Total Debt | ~92% | ~8% | Federal dominates by volume |
| Avg Interest Rate (Current) | ~5.5% (undergrad) | ~7–13% (varies) | Private rates exceed federal |
| Rate Type | Fixed (lifetime) | Fixed or Variable | Variable exposes borrowers to rate increases |
| Repayment Flexibility | High (IDR, forbearance) | Low (typically fixed term only) | Flexibility reduces statistical default risk |
| Default Rate (Historical) | ~10–15% (3-yr cohort) | Lower (due to co-signer/credit requirements) | Selection effect: private lenders screen for lower risk |
| Co-Signer Rate | 0% | ~85% | Private loans rely on co-signer credit |
Source: Department of Education — Federal Student Aid Portfolio Data; CFPB Private Education Loan Report 2024; College Board Trends in Student Aid.
The statistical implication: federal borrowers face lower monthly rates but have less selection bias — they include borrowers who would not qualify for private loans, producing a wider standard deviation in repayment outcomes. See the standard deviation page for how variability in borrower risk translates to portfolio-level statistics.
Section 5: Student Loan Debt by Age Group
Contrary to popular perception, student debt is not limited to young adults. Repayment timelines of 20–25 years mean many borrowers carry debt into middle age and retirement. Additionally, Parent PLUS loans — federal loans taken by parents for dependent students — extend the age distribution upward.
Table 4: Student Loan Debt by Age Group (2024)
| Age Group | % With Student Debt | Avg Balance (Among Holders) | Median Balance | Key Note |
|---|---|---|---|---|
| Under 25 | ~22% | ~$16,000 | ~$11,000 | Recent graduates begin repayment |
| 25–34 | ~34% | ~$33,000 | ~$22,000 | Peak borrowing age; largest cohort |
| 35–49 | ~22% | ~$42,000 | ~$28,000 | Extended repayment; graduate/professional debt |
| 50–64 | ~12% | ~$45,000 | ~$30,000 | Parent PLUS and co-signed loans |
| 65+ | ~8% | ~$38,000 | ~$24,000 | ~8.8 million borrowers over 50 |
Source: Federal Reserve Survey of Consumer Finances 2022 (latest wave); Education Data Initiative — Student Loan Debt by Age 2024; Department of Education NSLDS Age Distribution Data.
Approximately 8.8 million borrowers are over age 50, and roughly 22% of borrowers over 60 still carry student debt — a statistical shift with significant implications for retirement wealth accumulation, which Section 11 addresses.
Section 6: Debt by Income, Race, and Geography
Borrowing patterns vary significantly by demographic group, producing statistically significant differences in debt burden, repayment speed, and default probability.
Table 5: Borrowing Patterns by Demographic (2024)
| Group / Category | Borrowing Rate (Bachelor’s) | Avg Debt (Among Borrowers) | Default Risk Note |
|---|---|---|---|
| White | ~55% | ~$32,000 | Near national average |
| Black | ~70% | ~$39,000 | Higher debt; longer repayment timelines |
| Hispanic | ~52% | ~$28,000 | Lower borrowing rate but rising |
| Asian | ~48% | ~$29,000 | Lower borrowing, faster repayment |
| First-Generation | ~65% | ~$35,000 | Higher borrowing; lower family wealth support |
| Low-Income (Bottom Quartile) | ~68% | ~$28,000 | Higher default risk despite lower balances |
| Middle-Income | ~58% | ~$33,000 | Most stable repayment profile |
Source: Brookings Institution — Student Debt and Racial Wealth Gap; Federal Reserve Survey of Consumer Finances 2022; TICAS — Racial Disparities in Student Debt 2024.
The data show that Black bachelor’s degree recipients borrow at higher rates (70%) and carry higher average balances ($39,000) compared to White recipients (~55% and ~$32,000). This disparity is not explained solely by tuition differences; it reflects differences in family wealth, access to non-loan funding sources (grants, family contributions), and choice of institution. Over the repayment lifecycle, these initial differences compound into larger wealth gaps — a statistical interaction between debt, compound interest, and delayed asset accumulation.
Section 7: Default and Delinquency — Statistical Definitions
Default (federal loans): 270 or more days past due (~9 months of missed payments). At default, the full balance becomes immediately due, and the government may garnish wages or intercept tax refunds.
Delinquency: Typically 30–89 days past due; a leading indicator of eventual default.
The federal government tracks cohort default rates (CDR) — the percentage of borrowers entering repayment in a given fiscal year who default within a specified window (typically 3 or 5 years).
Table 6: Federal Cohort Default Rates (Cohort Years)
| Cohort Year | Default Rate (3-Year) | Default Rate (5-Year) | Trend Note |
|---|---|---|---|
| 2010 | ~14.7% | ~21.5% | Peak default era (post-GFC) |
| 2012 | ~11.8% | ~18.2% | Declining due to IDR expansion |
| 2014 | ~11.5% | ~16.8% | Stable, but high relative to historical norms |
| 2016 | ~10.1% | ~14.8% | SAVE / REPAYE reduces defaults statistically |
| 2018 | ~9.2% | ~13.0% | Continued improvement |
| 2020 | ~6.0%* | ~8.5%* | COVID payment pause suppresses measured defaults |
| 2022 | ~7.5%* | — | Post-pause normalization begins; true rate likely higher |
*2020–2022 figures are artificially suppressed by the federal payment pause (March 2020 – September 2023).
Source: U.S. Department of Education — Cohort Default Rate Database; Federal Student Aid Portfolio Reports.
📊 Key Finding: The decline in measured default rates since 2010 reflects the expansion of Income-Driven Repayment (IDR) plans — which reduce monthly payments for low-income borrowers — rather than an improvement in underlying borrower financial health. When payments are reduced to $0 (as occurs under SAVE for some borrowers), statistical default declines, but the underlying debt and accumulated interest remain. This is a critical statistical distinction: default rate is a flow measure of repayment failure, not a stock measure of debt burden.
Section 8: Repayment Plan Statistics — Standard, IBR, SAVE
Federal borrowers may select from multiple repayment structures. The choice of plan significantly affects both monthly cash flow and total interest accumulation over time.
Table 7: Borrowers by Repayment Plan (2024)
| Plan Type | % of Borrowers | Avg Monthly Payment | Avg Repayment Term | Key Feature |
|---|---|---|---|---|
| Standard (10-Year Fixed) | ~28% | ~$401 (at $37K, 5.5%) | 120 months | Fastest payoff; lowest total interest |
| Graduated (10-Year Rising) | ~8% | Starts low; rises every 2 years | 120 months | Assumes rising income |
| Extended (25-Year Fixed) | ~15% | ~$227 (same loan) | 300 months | Lower monthly; much higher total interest |
| Income-Based (IBR) — Old | ~12% | 10–15% of discretionary income | 20–25 years | Forgiveness at end of term |
| PAYE | ~10% | 10% of discretionary income | 20 years | For newer borrowers (post-2007) |
| SAVE (2023+) | ~20% | ~5–10% of discretionary income | 20 years (undergrad) / 25 (grad) | Reduces payments by ~30–50% vs. REPAYE |
| Forbearance / Deferment | ~7% | $0 (temporary) | Variable | Interest continues to accrue on unsubsidized loans |
Source: Department of Education — Federal Student Aid Portfolio (2024); Congressional Budget Office — SAVE Plan Cost Estimates; Student Aid Data.
As shown on the geometric mean page, extending the repayment term from 10 years to 25 years does not halve the monthly payment proportionally — it reduces it by only about 43% (from $401 to $227) — because compound interest continues to accumulate on the larger remaining principal for an additional 15 years. The geometric average of the debt service over 25 years is substantially higher than the arithmetic intuition suggests.
Section 9: The Mathematics of Education Debt — Worked Example
This section demonstrates how amortization, compound interest, and repayment term interact statistically. The monthly payment for a fixed-rate amortizing loan is calculated as:
M=P×r(1+r)n(1+r)n−1
Where:
- M = monthly payment
- P = principal ($37,000)
- r = monthly interest rate (APR ÷ 12)
- n = number of payments (months)
Worked Example: $37,000 Federal Loan at 5.5%
Parameters:
- Principal (P): $37,000
- APR: 5.5% → Monthly rate (r) = 0.055 ÷ 12 = 0.004583
- Term: 120 months (10 years standard)
Calculation:
M=37,000×0.004583(1.004583)120(1.004583)120−1
First, calculate (1.004583)120:
(1.004583)120≈1.723
Then:
M=37,000×0.004583×1.7231.723−1=37,000×0.0079060.723≈37,000×0.01093≈$401
Results (10-Year Standard Repayment):
- Monthly Payment: ~$401
- Total Payments: $401 × 120 = ~$48,120
- Total Interest: $48,120 − $37,000 = ~$11,120
- Interest as % of Principal: ~30.1%
Comparison: Extended 25-Year Repayment
- Monthly Payment: ~$227 (43% lower monthly burden)
- Total Payments: $227 × 300 = ~$68,100
- Total Interest: $68,100 − $37,000 = ~$31,100
- Interest as % of Principal: ~84.1%
Statistical Insight: Extending the term by 15 years reduces the monthly payment by 43% but increases the total interest by approximately 180% ($11,120 → $31,100). This is compound interest working against the borrower over an extended time horizon. For the positive-growth analog — where compound interest works in the borrower’s favor — see the Compound Interest Statistics page, which applies the same formula to savings and investment accumulation. See also the geometric mean page, which explains why multi-period cost comparisons require geometric rather than arithmetic averaging.
Section 10: Forgiveness, Cancellation, and Income-Driven Repayment
Since 2021, federal policy has canceled or forgiven approximately $175 billion in student loan debt through a combination of Public Service Loan Forgiveness (PSLF), borrower defense claims, SAVE plan adjustments, and targeted cancellation programs.
Table 8: Forgiveness & Cancellation Statistics
| Program | Borrowers Affected | Amount Forgiven / Projected | Status / Timeline |
|---|---|---|---|
| PSLF (Cumulative) | ~1,000,000+ | ~$72 billion | Ongoing; 120 qualifying payments |
| SAVE (20-Year Projection) | Projected millions | ~$475 billion (CBO est.) | Active since 2023 |
| Biden-Harris Cancellation (2022–24) | ~4.8 million | ~$175 billion (total across all programs) | Partially blocked / modified |
| Borrower Defense (Schools) | ~1.3 million | ~$28 billion | Ongoing litigation |
| Total Disability / Death | ~800,000 | ~$25 billion | Automatic discharge program |
Source: Department of Education — Federal Student Aid Portfolio Reports; White House — Student Debt Relief Fact Sheets; Congressional Budget Office — SAVE Plan Cost Projections.
The statistical effect of forgiveness is to reduce the aggregate debt burden, but it does not eliminate the underlying flow: approximately $90–$100 billion in new federal student loans are issued annually. The net change in total debt depends on whether forgiveness outpaces new issuance — in 2024, forgiveness and reduced borrowing produced a near-zero net change.
Section 11: Student Debt and Wealth Accumulation — Statistical Impact
Student debt delays household wealth accumulation through multiple statistical channels: reduced homeownership rates, lower retirement account contributions, and decreased small-business formation.
Table 9: Student Debt Impact — Key Indicators
| Indicator | With Student Debt | Without Student Debt | Gap / Note |
|---|---|---|---|
| Median Net Worth (Age 30–40) | ~$36,000 | ~$110,000 | ~$74,000 gap |
| Homeownership Rate (Age 30–35) | ~42% | ~60% | ~18 percentage point delay |
| Retirement Account Ownership (Age 30) | ~35% | ~55% | Lower savings rate; debt service crowds out contributions |
| Small Business Formation (Age 35) | Lower by ~20% | Baseline | Debt service reduces risk-taking capacity |
| Marriage Rate (Age 25–34) | Slightly lower | Baseline | Correlated with debt burden, not necessarily causal |
Source: Federal Reserve Survey of Consumer Finances 2022; Brookings Institution — Hamilton Project; Institute for College Access & Success (TICAS).
The ~$74,000 net worth gap by age 30–40 is particularly significant because of compound growth: missing 10 years of retirement contributions at a 7% return produces a lifetime gap far larger than the original debt. For the statistical relationship between debt, savings, and long-run wealth, see the Net Worth Statistics page and the Retirement Savings Statistics page.
Section 12: Interactive Student Loan Repayment Calculator
💰 Federal Student Loan Repayment Calculator
Use the inputs below to model repayment costs across different federal plan options.
Inputs:
- Loan Principal ($): ______
- Interest Rate (%): ______ (federal undergrad: ~5.5%)
- Repayment Plan: [Standard 10yr] [Extended 25yr] [SAVE / IDR Approximation]
- Projected Annual Income ($): ______ (for IDR estimates only)
- Family Size: ______
Outputs (Calculated):
- Monthly payment amount
- Total payments over life of loan
- Total interest paid
- Interest as % of original principal
- Forgiveness estimate (for SAVE/IDR: remaining balance at term end)
- Comparison line: “Standard 10yr: $X/month, $Y total; Extended: $Z/month, $W total”
⚠️ Calculator Disclaimer
This calculator uses standard amortization formulas for fixed-rate loans and simplified income-driven approximations. Actual federal payments depend on Adjusted Gross Income (AGI), family size, state of residence, loan type (subsidized vs. unsubsidized), and annual recertification. See StudentAid.gov for official Department of Education estimates.
Section 13: Evidence-Based Debt Management Strategies
Four strategies emerge consistently from Department of Education repayment data and behavioral finance research.
📉 Strategy 1: Prioritize High-Rate Loans (Avalanche)
For borrowers with both federal (~5.5%) and private (~7–13%) loans, directing extra payments toward the highest-rate loan minimizes compound accumulation. As shown in Section 9, a 2-percentage-point rate difference (5.5% vs. 7.5%) on $37,000 produces approximately $3,800 more in total interest over 10 years — demonstrating why rate dominates in multi-period debt calculations. See the Compound Interest Statistics page for the full growth formula applied to debt accumulation.
🏛️ Strategy 2: Enroll in Income-Driven Repayment (SAVE / IBR)
The SAVE plan reduces undergraduate loan payments to approximately 5–10% of discretionary income (income above 225% of the federal poverty line). Statistical studies from the Department of Education show that borrowers in IDR plans have 30–40% lower default rates than comparable borrowers in standard repayment, primarily because payments adjust downward during income disruptions rather than remaining fixed.
💼 Strategy 3: Public Service Loan Forgiveness (PSLF)
Borrowers employed full-time by government or qualifying nonprofit organizations may receive full forgiveness of remaining federal balances after 120 qualifying monthly payments (~10 years). With an average forgiveness amount exceeding $60,000, PSLF produces one of the highest statistical returns available — but requires precise employment certification and plan eligibility tracking. See Section 10 for cumulative forgiveness data.
⚠️ Strategy 4: Avoid Forbearance Unless Necessary
Forbearance pauses payments temporarily, but interest continues to accrue on unsubsidized loans — and for subsidized loans, the government stops paying interest, meaning the borrower assumes it. Statistical analysis shows borrowers who use forbearance accumulate significantly higher long-term balances than those using IDR plans, because IDR maintains payments (even if reduced to $0 for very low incomes) without allowing interest capitalization events.
Section 14: Key Statistical Patterns From the Data
The $1.75 Trillion Figure: Second only to mortgages ($12.5T) and exceeding both credit cards ($1.17T) and auto loans (~$1.61T) in total household debt volume.
Right-Skew in Balances: The mean ($37,850) exceeds the median ($20,000) by nearly 2×, driven by graduate and professional borrowers holding balances of $150,000+. Any analysis using only the mean systematically overestimates the typical borrower’s burden.
Default Is Not Uniform: Borrowers who do not complete their degree have significantly higher default rates (~25–30%) compared to bachelor’s degree completers (~10%) and graduate/professional degree holders (~3–5%). The degree serves as both a statistical predictor of earnings capacity and a signal of borrower persistence.
Age Distribution Shift: Student debt repayment now extends into retirement years. Approximately 8.8 million borrowers are over age 50, and roughly 22% of borrowers over 60 still carry student debt — a demographic shift that affects retirement savings statistics and household wealth accumulation timelines.
Forgiveness vs. Flow: While approximately $175 billion has been canceled, new borrowing continues at ~$90–100 billion annually. The aggregate debt trajectory depends on whether forgiveness and repayment outpace new issuance — in 2024, they roughly balanced, producing near-zero net growth.
Section 15: Frequently Asked Questions
Q1: How much student loan debt does the average borrower have?
The average federal borrower holds approximately ~$37,850 [DoE NSLDS]. However, the median is lower — approximately ~$20,000 — because a small share of graduate and professional borrowers hold very large balances ($150,000+). For bachelor’s degree recipients specifically, the average is closer to ~$29,000 (public and private combined).
Q2: What is the current federal student loan interest rate?
For loans disbursed after July 2024, federal undergraduate direct loans carry a fixed rate of approximately 6.53% (set annually based on the 10-year Treasury note auction plus a statutory margin). Graduate unsubsidized loans are approximately 8.08%, and PLUS loans (graduate and parent) are approximately 9.08%. These rates are fixed for the life of the loan. For the statistical impact of rate changes over repayment terms, see Section 9.
Q3: What is the student loan default rate?
The federal 3-year cohort default rate was approximately ~7.5% for the 2022 cohort (with 2020–2022 figures suppressed by the payment pause). Before the COVID pause, 2018 cohorts showed approximately ~9.2% default within 3 years. Borrowers who do not complete their degree have default rates of approximately 25–30%, compared to approximately ~10% for bachelor’s completers and ~3–5% for graduate/professional degree holders [DoE Cohort Default Rate Database].
Q4: Should I pay off student loans or invest?
The statistical comparison depends on the rate spread. If student loans are at 5.5% (fixed, guaranteed return on prepayment) and investments earn an expected ~10% (historical S&P 500 nominal return, highly variable), the arithmetic favors investing. However, the statistical comparison ignores risk: loan prepayment is a guaranteed 5.5% return; equity returns are volatile (standard deviation ~15–16%). See the Stock Market Statistics page for return distributions. Additionally, investment returns are taxed; loan prepayment is not. The statistically conservative approach is to eliminate high-rate private loans first, then compare risk-adjusted returns.
Q5: What is the SAVE repayment plan?
SAVE (Saving on a Valuable Education) is an Income-Driven Repayment plan introduced in 2023. For undergraduate loans, payments are set at approximately 5% of discretionary income (above 225% of the federal poverty line). Unpaid interest does not accrue if the monthly payment covers it — a significant statistical improvement over prior plans where unpaid interest capitalized. The Congressional Budget Office estimates SAVE will cost approximately $475 billion over 20 years, primarily through reduced payments and earlier forgiveness timelines.
Q6: Can student loans be discharged in bankruptcy?
Federal student loans are rarely dischargeable in bankruptcy unless the borrower proves “undue hardship” in an adversarial proceeding — a legal standard that applies to only a small fraction (~0.1%) of bankruptcy filings involving student debt. Private loans may be dischargeable in some jurisdictions, but courts apply varying standards. From a statistical perspective, student debt is unique among consumer obligations: it is unsecured (no collateral) yet non-dischargeable, creating an asymmetric risk profile not seen in mortgages, auto loans, or credit card debt.
Key Terms Glossary
Principal: The original amount borrowed, excluding accrued interest. For federal loans, principal is the disbursed amount minus any capitalized fees.
APR / Interest Rate (Fixed vs. Variable): The annual cost of borrowing, expressed as a percentage. Federal student loans have fixed rates; private loans may be fixed or variable (tied to an index such as SOFR or Prime).
Amortization: The process of gradually paying off debt through scheduled payments that cover both principal and interest. The amortization formula (Section 9) produces constant monthly payments for fixed-rate loans.
Cohort Default Rate (CDR): A statistical measure tracking the percentage of borrowers entering repayment in a specific fiscal year who default within 3 or 5 years. A longitudinal sampling method — see sampling distributions.
Income-Driven Repayment (IDR): A family of federal repayment plans that cap monthly payments at a percentage of discretionary income (10–20%, depending on plan). SAVE (Section 13) is the most recent IDR option.
SAVE Plan: Saving on a Valuable Education — an IDR plan reducing undergraduate payments to ~5% of discretionary income and preventing unpaid interest accumulation.
Forbearance vs. Deferment: Temporary suspension of payments. In forbearance, interest accrues on all loan types. In deferment, interest accrues on unsubsidized loans but not on subsidized loans. Both extend the debt timeline and increase total compound cost.
Subsidized vs. Unsubsidized Loans: Subsidized federal loans do not accrue interest while the borrower is in school, in grace, or in deferment. Unsubsidized loans accrue interest continuously — compound accumulation begins immediately upon disbursement.
PSLF (Public Service Loan Forgiveness): A federal program providing full forgiveness of remaining balances after 120 qualifying payments for borrowers employed full-time by government or nonprofit employers.
Compound Interest (Debt Accumulation): Interest calculated on both principal and previously accrued unpaid interest. At 5.5% over 25 years, compound interest produces approximately 84% of the original principal in additional cost (Section 9).
📖 Statistical Concepts Used On This Page
- Amortization Formula: Monthly payments for fixed-rate loans are calculated using compound interest on a declining balance: M=P×[r(1+r)n]/[(1+r)n−1]. See the full compound growth and decay formula on the Compound Interest Statistics page.
- Geometric Mean: Repayment costs over multi-year terms must be averaged geometrically. The arithmetic mean of annual interest rates understates total cost because interest accumulates on accumulated interest. See the geometric mean page.
- Standard Deviation: Borrower balances show high standard deviation (
$40,000) due to graduate and professional outliers. The spread explains why the mean ($37,850) exceeds the median (~$20,000) by nearly 2×. See the standard deviation page. - Median vs. Mean: Student loan distributions are right-skewed. The median (
$20,000) represents the typical borrower more accurately than the mean ($37,850), which is pulled upward by high-balance professional-degree borrowers. See the descriptive statistics page and the mean vs. median vs. mode page. - Cohort Default Rate (Longitudinal Sampling): The CDR tracks a defined group (cohort) entering repayment in a specific year over a 3- or 5-year window. This is a longitudinal sampling design — see the sampling distributions page for how cohort tracking differs from cross-sectional surveys.
- Percentage Change and Growth Rate: Used for debt trajectory analysis (Table 1). Note that percentage changes in aggregate debt can exceed population or wage growth, signaling rising per-capita leverage. See the descriptive statistics page.
- Cross-Reference Comparisons: For context on how student debt affects household net worth, see the Net Worth Statistics page. For comparison with other high-interest consumer debt, see the Credit Card Debt Statistics page. For investment return benchmarks that borrowers might compare against prepayment, see the Stock Market Statistics page and the Retirement Savings Statistics page.
Data Sources & Related Articles
Primary Data Sources:
- U.S. Department of Education — Federal Student Aid (studentaid.gov): NSLDS borrower statistics, loan simulator, repayment plan documentation, cohort default rate database, forgiveness reports.
- Federal Reserve Bank of New York — Household Debt and Credit Report: Aggregate student debt figures by quarter and year.
- College Board — Trends in Student Aid: Annual tuition, borrowing, and debt-at-graduation data by institution type and degree level.
- Institute for College Access & Success (TICAS) — Project on Student Debt: State-level borrowing data, demographic disparity analysis, and institutional debt rankings.
- Brookings Institution — Hamilton Project: Economic impact studies on student debt and wealth accumulation.
- Congressional Budget Office (CBO): SAVE plan cost projections and federal student loan portfolio forecasts.
Related Articles on LearnMinto.com:
- Personal Finance Statistics: Savings, Debt & Money Habits — Broader household debt context including emergency savings and retirement readiness.
- Credit Card Debt Statistics: Average Balance, Interest & Trends — Comparative context for revolving consumer debt costs.
- Stock Market Statistics: Historical Returns, Volatility & Key Data — Return benchmarks for comparing investment vs. debt prepayment decisions.
Data reflects the most recently available primary-source figures as of 2025. Federal student loan policies, interest rates, and forgiveness programs are subject to legislative and regulatory change. This page is statistical reference material for educational purposes only.