
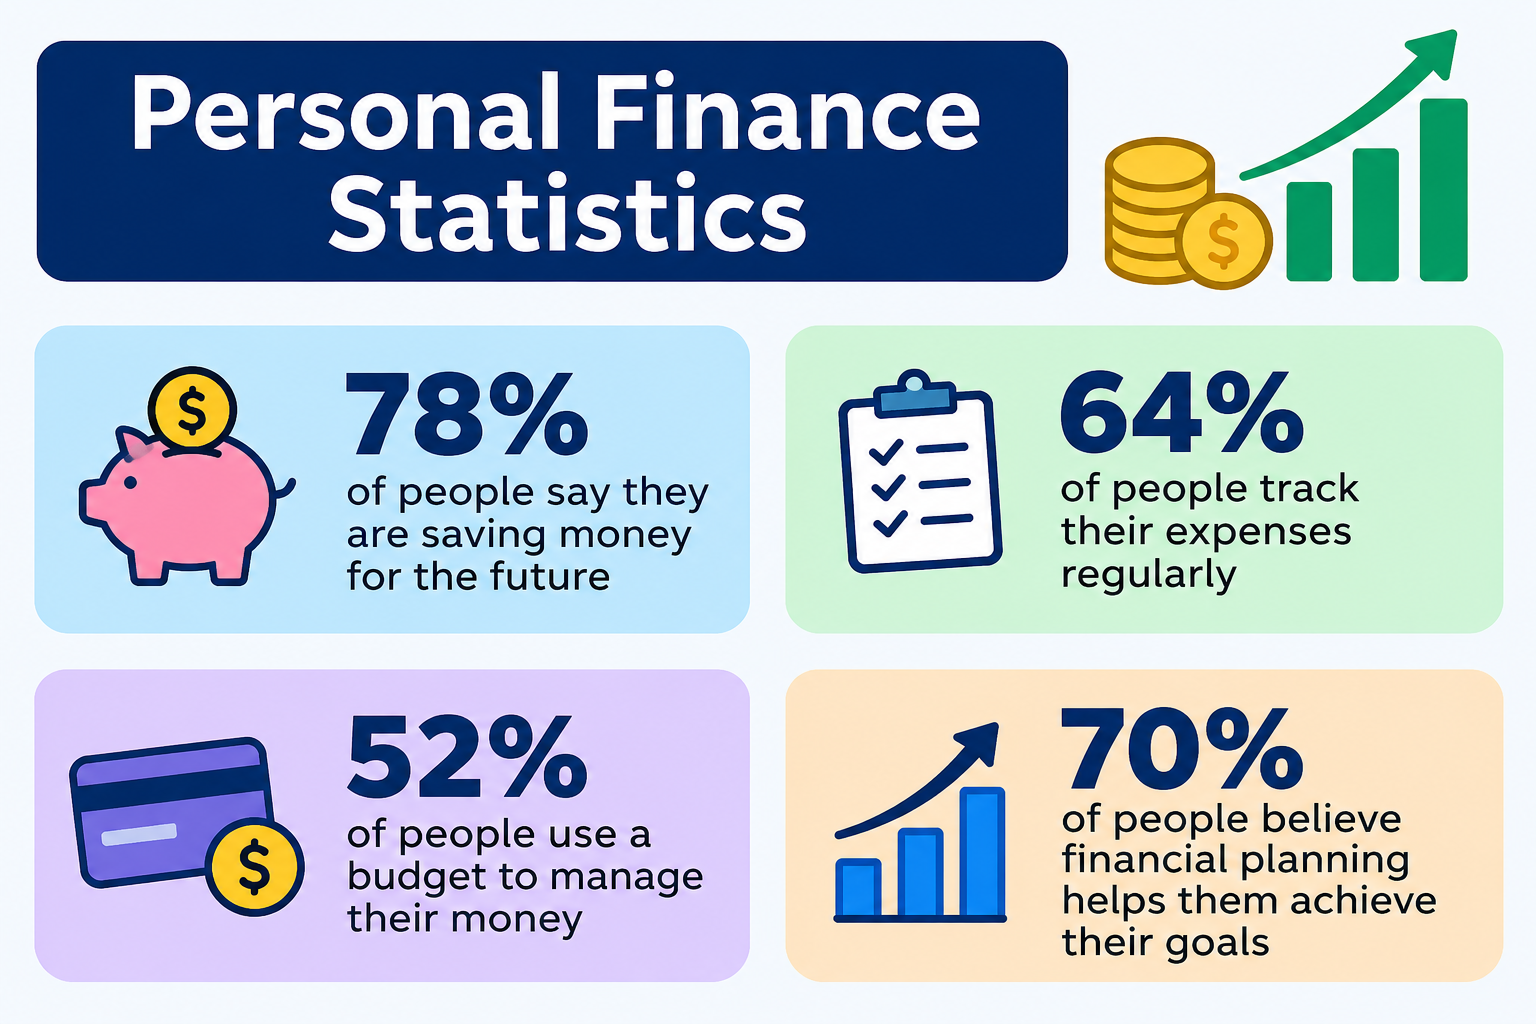
Nearly 57% of Americans cannot cover a $1,000 emergency expense from savings alone — yet the average U.S. household carries over $101,000 in total debt across mortgages, credit cards, auto loans, and student borrowing. The gap between what Americans earn, what they spend, and what they keep defines one of the most consequential statistical stories in modern economics.
This page compiles primary-source personal finance statistics covering savings rates, debt levels, spending habits, and money behavior data through 2025.
What This Page Covers
✓ U.S. personal savings rate — historical data
✓ Average American debt by type
✓ Emergency fund statistics
✓ Retirement savings data by age group
✓ Consumer spending habits and patterns
✓ Credit card usage and interest data
✓ Net worth statistics by age
✓ Financial stress and money anxiety data
✓ Interactive personal finance calculator
✓ Evidence-based money management strategies
Executive Summary: Core Personal Finance Benchmarks
| Stat | Value | Label |
|---|---|---|
| 💰 | 3.6% | U.S. Personal Savings Rate (2024) |
| ⚠️ | 57% | Americans With Less Than $1,000 Saved |
| 📊 | $17.5T | Total U.S. Household Debt (2024) |
| 😟 | 78% | Americans Living Paycheck to Paycheck |
These four numbers frame the central tension in American personal finance: a historically low savings rate, widespread debt accumulation, near-universal financial fragility, and a retirement savings shortfall that compounds with every passing year.
⚠️ Important Disclaimer
All statistics on this page are for educational purposes only. Data is sourced from government agencies, academic research, and financial institutions. This is not financial advice. Consult a qualified financial advisor before making financial decisions.
Primary sources: Bureau of Economic Analysis (BEA); Federal Reserve Survey of Consumer Finances; Federal Reserve Bank of New York; Bureau of Labor Statistics; Fidelity Investments; Vanguard.
U.S. Personal Savings Rate — Historical Data
What Is the Personal Savings Rate?
The personal savings rate is defined by the Bureau of Economic Analysis (BEA) as personal saving as a percentage of disposable personal income. In practical terms:
Personal Savings Rate = (Disposable Income − Personal Outlays) ÷ Disposable Income × 100
Disposable income includes wages, salaries, transfer payments, and investment income after taxes. Personal outlays include consumer spending, interest payments, and transfer payments to government. The rate measures what fraction of after-tax income households retain rather than spend.
Table 1: U.S. Personal Savings Rate by Decade
| Decade | Avg Savings Rate | High Point | Low Point | Notable Events |
|---|---|---|---|---|
| 1960s | ~8.0% | 10.9% (1968) | 5.6% (1965) | Post-war prosperity, stable wages |
| 1970s | ~10.0% | 14.6% (1975) | 7.5% (1979) | Oil shocks, inflation uncertainty |
| 1980s | ~9.0% | 12.2% (1981) | 6.5% (1987) | Disinflation, credit expansion |
| 1990s | ~6.5% | 8.7% (1992) | 2.4% (1999) | Dot-com wealth effect, low unemployment |
| 2000s | ~3.5% | 6.0% (2008) | 1.9% (2005) | Housing bubble, credit availability |
| 2010s | ~6.5% | 8.3% (2012) | 3.4% (2019) | Post-GFC recovery, rising markets |
| 2020–2025 | ~8.5% | 33.8% (Apr 2020) | 2.7% (mid-2022) | COVID stimulus spike, post-COVID decline |
Source: Bureau of Economic Analysis Personal Income and Outlays data, FRED.
The COVID Savings Anomaly
In April 2020, the U.S. personal savings rate reached an unprecedented 33.8% — the highest recorded figure in the BEA dataset going back to 1959. Three simultaneous factors drove this:
- Stimulus payments deposited directly into household accounts
- Forced reduction in spending as restaurants, travel, and entertainment closed
- Precautionary saving driven by economic uncertainty
By mid-2022, the rate had collapsed back to 2.7% as stimulus ran out, inflation eroded purchasing power, and consumers resumed spending. This statistical anomaly illustrates how aggregate savings rates are sensitive to policy shocks — a concept directly related to how outliers distort time-series data, covered in the descriptive statistics guide on this site.
Table 2: Personal Savings Rate by Country (2024)
| Country | Savings Rate | vs. U.S. | Notes |
|---|---|---|---|
| China | ~35% | +31.4 pp | High household and corporate saving culture |
| Germany | ~20% | +16.4 pp | Strong precautionary saving tradition |
| India | ~18% | +14.4 pp | Limited social safety net drives saving |
| France | ~17% | +13.4 pp | High social benefits + cultural saving |
| Japan | ~15% | +11.4 pp | Aging population increasing retirement saving |
| Canada | ~8% | +4.4 pp | Housing market wealth effect |
| Australia | ~7% | +3.4 pp | Compulsory superannuation system |
| UK | ~6% | +2.4 pp | Low savings culture, high consumer debt |
| U.S. | ~3.6% | — | Near historic lows as of 2024 |
Source: OECD National Accounts Savings Data 2024; BEA.
The U.S. savings rate ranks among the lowest of major developed economies. Germany saves at roughly 5.5 times the U.S. rate. China’s household savings rate, while partly driven by the absence of a robust public pension system, demonstrates how institutional design shapes aggregate saving behavior.
American Savings Statistics
📊 Key Finding: The Federal Reserve’s Survey of Consumer Finances (2022, latest available) found that the median transaction account balance for American families was $8,000 — but the average was $62,500, a gap entirely explained by high-balance households pulling the mean upward.
Table 3: Emergency Fund Statistics by Income Level
| Income Bracket | % With No Savings | % With 3+ Months Expenses | Median Amount Saved |
|---|---|---|---|
| Under $30,000 | ~49% | ~14% | ~$400 |
| $30,000–$50,000 | ~35% | ~22% | ~$2,000 |
| $50,000–$75,000 | ~23% | ~35% | ~$5,500 |
| $75,000–$100,000 | ~14% | ~48% | ~$12,000 |
| $100,000+ | ~6% | ~72% | ~$40,000+ |
Source: Bankrate Annual Emergency Savings Report 2024; Federal Reserve Report on Economic Well-Being of U.S. Households (2023).
The inverse relationship between income and financial fragility is statistically consistent across every survey wave since 2013. Households earning under $30,000 are 3.5 times more likely to have zero savings than households earning over $75,000.
Table 4: Average Savings Balance by Age Group
| Age Group | Avg Savings Balance | Median Savings Balance | % With Nothing Saved |
|---|---|---|---|
| Under 35 | ~$20,500 | ~$5,400 | ~29% |
| 35–44 | ~$41,500 | ~$10,100 | ~24% |
| 45–54 | ~$57,800 | ~$12,000 | ~22% |
| 55–64 | ~$57,600 | ~$11,900 | ~21% |
| 65+ | ~$60,400 | ~$13,800 | ~19% |
Source: Federal Reserve Survey of Consumer Finances 2022; FDIC National Survey of Unbanked and Underbanked Households.
The divergence between average and median savings at every age group reinforces why the median is the appropriate central tendency measure for skewed financial data. For a full explanation of why mean vs. median matters in data with outliers, see the mean vs. median page on this site.
American Debt Statistics
Total U.S. household debt reached $17.5 trillion in Q4 2024, according to the Federal Reserve Bank of New York’s Household Debt and Credit Report — a figure that has grown in every year except 2009–2012 following the Global Financial Crisis.
Table 5: U.S. Household Debt by Type (2024)
| Debt Type | Total Amount | Avg Per Household | Avg Interest Rate | % of Americans With This Debt |
|---|---|---|---|---|
| Mortgage | ~$12.5T | ~$244,000 | 6.8–7.5% (2024) | ~43% |
| Student Loans | ~$1.75T | ~$37,850 | 5.5–7.5% federal | ~13% |
| Auto Loans | ~$1.61T | ~$23,792 | 7.1–11.3% | ~35% |
| Credit Cards | ~$1.17T | ~$6,329 | 21–24% | ~61% |
| Medical Debt | ~$88B (reported) | ~$2,200 | 0–29.9% | ~14% |
| Personal Loans | ~$245B | ~$11,548 | 11–21% | ~10% |
Source: Federal Reserve Bank of New York Q4 2024 Household Debt Report; Experian 2024 State of Credit; Consumer Financial Protection Bureau.
Table 6: Total U.S. Household Debt by Year
| Year | Total Debt | YoY Change | Notable Event |
|---|---|---|---|
| 2000 | $7.1T | — | Baseline reference |
| 2005 | $10.3T | +$3.2T | Housing bubble expansion |
| 2008 | $12.7T | +$2.4T | Peak pre-crisis debt |
| 2010 | $11.7T | −$1.0T | Post-GFC deleveraging |
| 2015 | $12.1T | +$0.4T | Gradual recovery |
| 2019 | $14.2T | +$2.1T | Pre-COVID peak |
| 2020 | $14.6T | +$0.4T | COVID — mortgage + auto surge |
| 2022 | $16.9T | +$2.3T | Fastest growth in 15 years |
| 2024 | $17.5T | +$0.6T | All-time record |
Source: Federal Reserve Bank of New York Center for Microeconomic Data.
✅ Key Finding: U.S. household debt has grown 146% since 2000 in nominal terms. Adjusting for inflation and population growth, real per-capita debt has approximately doubled over the same period.
Credit Card Statistics
Credit card debt crossed $1.17 trillion for the first time in U.S. history in 2024. The average APR on credit cards carrying a balance reached 21.5% — the highest rate recorded since the Federal Reserve began tracking in 1994.
Table 7: Credit Card Statistics Snapshot (2024)
| Metric | Data | Source |
|---|---|---|
| Total U.S. credit card debt | $1.17 trillion | NY Fed Q4 2024 |
| Average balance per cardholder | ~$6,329 | Experian 2024 |
| Average APR (balance-carrying accounts) | ~21.5% | Federal Reserve G.19 |
| % Americans with at least one credit card | ~82% | Federal Reserve |
| % carrying balance month-to-month | ~48% | American Bankers Association |
| % making minimum payment only | ~35% | CFPB 2024 |
| Average number of cards per adult | 3.9 | Experian |
| % with credit card debt over $10,000 | ~12% | LendingTree 2024 |
Source: Federal Reserve G.19 Consumer Credit; Experian State of Credit 2024; CFPB Consumer Credit Card Market Report.
Worked Example: The True Cost of Minimum Payments
Scenario: $5,000 balance at 24% APR, minimum payment = 2% of balance or $25 (whichever is greater).
Starting Balance:     $5,000
APR:                  24% (2% per month)
Minimum Payment:      ~$100 (Month 1, declining)

Time to pay off:      approximately 22 years
Total interest paid:  approximately $7,314
Total amount paid:    approximately $12,314
The same $5,000 paid off in 24 fixed monthly installments:
Fixed monthly payment: ~$264
Total interest paid:   ~$336
Total paid:            ~$5,336
Interest saved:        ~$6,978
Paying a fixed amount instead of the minimum reduces total interest paid by approximately 95% and eliminates the debt in 24 months instead of 22 years. The mathematical principle behind this is compound growth working against the borrower — the same compounding that builds wealth in investments destroys it in high-interest debt. See the compound interest statistics page for the full formula breakdown.
Table 8: Average Credit Card Debt by Age Group
| Age Group | Avg Balance | % Carrying Balance | Avg APR Paid |
|---|---|---|---|
| 18–34 | ~$3,200 | ~41% | ~22.1% |
| 35–44 | ~$6,750 | ~52% | ~21.8% |
| 45–54 | ~$8,100 | ~54% | ~21.3% |
| 55–64 | ~$7,200 | ~50% | ~20.9% |
| 65+ | ~$4,900 | ~38% | ~20.1% |
Source: Experian State of Credit 2024; Federal Reserve Survey of Consumer Finances 2022.
The 45–54 age group carries the highest average credit card balance — a pattern consistent across every Federal Reserve survey wave since 2004, reflecting peak earning years coinciding with peak spending on housing, children, and lifestyle costs.
Retirement Savings Statistics
📊 Key Finding: According to Vanguard’s How America Saves 2024 report, the median 401(k) balance across all account holders is $35,286 — a figure that falls dramatically short of what financial planners recommend at nearly every age.
Table 9: Average Retirement Savings by Age (2024)
| Age Group | Avg 401(k) Balance | Median 401(k) Balance | Recommended Amount* | Gap (Median) | % With No Retirement Savings |
|---|---|---|---|---|---|
| 20s | ~$15,400 | ~$6,100 | ~$20,000 | −$13,900 | ~41% |
| 30s | ~$51,800 | ~$22,100 | ~$90,000 | −$67,900 | ~34% |
| 40s | ~$106,000 | ~$48,000 | ~$200,000 | −$152,000 | ~29% |
| 50s | ~$199,000 | ~$87,000 | ~$350,000 | −$263,000 | ~25% |
| 60s | ~$272,000 | ~$112,000 | ~$500,000+ | −$388,000 | ~22% |
*Recommended amounts based on Fidelity’s savings benchmarks (1× salary by 30, 3× by 40, 6× by 50, 8× by 60, 10× by 67).
Source: Vanguard How America Saves 2024; Fidelity Q3 2024 Retirement Analysis.
Table 10: Retirement Income Sources
| Income Source | % of Retirees Relying On It | Avg Monthly Amount |
|---|---|---|
| Social Security | ~90% | ~$1,907 |
| 401(k) / IRA withdrawals | ~42% | ~$1,200–$2,500 |
| Pension (defined benefit) | ~22% | ~$1,550 |
| Part-time work | ~27% | ~$800 |
| Family support | ~8% | ~$450 |
| Investment income | ~18% | ~$950 |
Source: Social Security Administration Annual Statistical Supplement 2024; Employee Benefit Research Institute Retirement Confidence Survey 2024.
Social Security was designed to replace approximately 40% of pre-retirement income for average earners. Financial planners typically target 70–80% income replacement. The gap between what Social Security provides and what retirees need is what 401(k) and IRA savings are meant to fill — yet 22% of Americans reach retirement age with zero dedicated retirement savings [Federal Reserve Survey of Consumer Finances 2022].
Net Worth Statistics
Why Median Net Worth Matters More Than Average
The average net worth of American families was approximately $1,059,470 in 2022 [Federal Reserve SCF 2022]. The median net worth was $192,700. The gap — over $866,000 — exists because a small number of extremely wealthy households pull the arithmetic mean far above the typical household experience.
This is a textbook case of positive skew in a distribution. When data has this shape, the median is always the more representative measure of what a “typical” household holds. For the statistical explanation of how skewness affects which measure of center to use, see the descriptive statistics page on this site.
Table 11: Net Worth by Age Group (2024, estimated from 2022 SCF)
| Age Group | Median Net Worth | Average Net Worth | Difference | Notes |
|---|---|---|---|---|
| Under 35 | ~$39,000 | ~$183,000 | $144,000 | Student debt drag, early career |
| 35–44 | ~$135,600 | ~$549,600 | $414,000 | Homeownership building equity |
| 45–54 | ~$247,200 | ~$975,800 | $728,600 | Peak earnings, peak wealth |
| 55–64 | ~$364,500 | ~$1,566,900 | $1,202,400 | Pre-retirement accumulation |
| 65–74 | ~$409,900 | ~$1,794,600 | $1,384,700 | Retirement transition |
| 75+ | ~$335,600 | ~$1,624,100 | $1,288,500 | Drawdown phase begins |
Source: Federal Reserve Survey of Consumer Finances 2022; estimated 2024 adjustments for asset price changes.
Table 12: Net Worth by Education Level
| Education Level | Median Net Worth | Avg Net Worth | Premium vs No HS Diploma |
|---|---|---|---|
| No high school diploma | ~$42,000 | ~$133,600 | — |
| High school diploma | ~$115,000 | ~$336,000 | +174% |
| Some college | ~$95,000 | ~$280,000 | +126% |
| Bachelor’s degree | ~$308,000 | ~$975,000 | +633% |
| Postgraduate degree | ~$534,000 | ~$1,580,000 | +1,171% |
Source: Federal Reserve Survey of Consumer Finances 2022.
The wealth premium associated with a bachelor’s degree versus a high school diploma — +633% in median net worth — is one of the most consistently replicated findings in personal finance research across every SCF wave since 1989.
Consumer Spending Statistics
The Bureau of Labor Statistics Consumer Expenditure Survey (2023) found the average American household spent $77,280 per year — approximately $6,440 per month — across all categories.
Table 13: Average American Spending by Category
| Category | Annual Amount | % of Total Spending | Monthly Amount |
|---|---|---|---|
| Housing | ~$25,400 | 32.9% | ~$2,117 |
| Transportation | ~$12,300 | 15.9% | ~$1,025 |
| Food (total) | ~$9,900 | 12.8% | ~$825 |
| Personal insurance & pensions | ~$9,200 | 11.9% | ~$767 |
| Healthcare | ~$6,200 | 8.0% | ~$517 |
| Entertainment | ~$3,800 | 4.9% | ~$317 |
| Cash contributions | ~$2,900 | 3.8% | ~$242 |
| Apparel & services | ~$2,000 | 2.6% | ~$167 |
| Education | ~$1,400 | 1.8% | ~$117 |
| Personal care | ~$900 | 1.2% | ~$75 |
| Other | ~$3,280 | 4.2% | ~$273 |
Source: Bureau of Labor Statistics Consumer Expenditure Survey 2023.
💡 Notable Spending Data Points:
- The average American spends approximately $1,200 per year on coffee [National Coffee Association 2024]
- U.S. households spend an average of $219 per month on subscription services — streaming, software, apps, gym memberships [C+R Research 2024]
- Impulse purchases account for approximately 40% of all e-commerce spending [Slickdeals National Savings Index 2023]
- Average annual restaurant and food delivery spending: approximately $3,030 per household [BLS CEX 2023]
Financial Stress Statistics
78% of American workers report living paycheck to paycheck as of 2024 [LendingTree/PYMNTS Consumer Finance Survey 2024]. Financial stress is not limited to low-income households — 44% of workers earning $100,000 or more also report paycheck-to-paycheck financial situations, illustrating that income alone does not determine financial stability.
Table 14: Financial Stress Statistics (2024)
| Metric | Percentage | Source |
|---|---|---|
| Americans stressed about money “always” or “often” | 72% | APA Stress in America 2024 |
| Living paycheck to paycheck | 78% | LendingTree 2024 |
| Lost sleep due to financial worry (past month) | 43% | National Foundation for Credit Counseling |
| Report money as top stressor | 65% | APA Stress in America 2024 |
| Avoid going to doctor due to cost | 38% | Gallup Health and Healthcare 2023 |
| Workers with $100k+ living paycheck to paycheck | 44% | PYMNTS 2024 |
| Americans who did not discuss finances with partner | 31% | Fidelity Couples & Money Study 2023 |
| Report financial stress affecting work performance | 48% | PwC Employee Financial Wellness Survey 2024 |
Source: American Psychological Association Stress in America 2024; LendingTree Financial Stress Report 2024; PwC Employee Financial Wellness Survey 2024.
Financial stress produces measurable physical and economic consequences. Research published in the Journal of Financial Therapy consistently finds correlations between financial stress and elevated cortisol levels, reduced immune function, and decreased workplace productivity. The standard deviation in financial stress scores between income groups is large — but the mean stress level remains elevated even among higher-income brackets, consistent with the hedonic adaptation and lifestyle inflation patterns documented in behavioral economics literature.
Personal Finance Calculator
📈 Savings Growth Calculator
Use the inputs below to model how your savings grow over time using the compound interest formula:
Formula: A = P(1 + r/n)^(nt) + PMT × [((1 + r/n)^(nt) − 1) / (r/n)]
Where:
- P = Current savings (principal)
- r = Annual interest rate (decimal)
- n = Compounding periods per year
- PMT = Monthly contribution
- t = Time in years
- A = Future value
Calculator Inputs:
- Monthly income: $______
- Monthly expenses: $______
- Current savings: $______
- Monthly savings contribution: $______
- Annual interest rate (savings account): ______%
- Time horizon: ______ years
Calculator Outputs:
- Projected savings after X years
- Emergency fund progress (vs. 3-month target)
- Current savings rate percentage
- Months to reach 3-month emergency fund
⚠️ Calculator Disclaimer
This calculator uses the standard compound interest formula with monthly compounding. Results are mathematical estimates only and do not account for taxes, inflation, variable interest rates, or changes in income. For real financial planning, consult a qualified financial advisor.
4 Evidence-Based Personal Finance Strategies
💰 Strategy 1: The 50/30/20 Budget Rule
What it is: Allocate 50% of after-tax income to needs, 30% to wants, and 20% to savings and debt repayment. Popularized by Senator Elizabeth Warren in All Your Worth (2005), the framework has consistent support in behavioral finance research.
The data: A 2022 study in the Journal of Financial Planning found that households following a formal budget accumulated 18% more net worth over 10-year periods than comparable households without a budget, controlling for income. The CFPB’s financial well-being research found that budgeters are 2.1× more likely to have a 3-month emergency fund.
🏦 Strategy 2: Automate Savings First
What it is: Direct deposit a fixed percentage to savings before spending begins — removing the decision entirely.
The data: Vanguard’s behavioral research found that employees with automatic 401(k) enrollment saved at 15× the rate of employees with opt-in enrollment at equivalent income levels. The Save More Tomorrow (SMarT) program, developed by behavioral economists Thaler and Benartzi, produced savings rate increases of 3.5 percentage points per year when workers pre-committed to future contribution increases — without reducing current consumption perception.
📉 Strategy 3: Pay High-Interest Debt First (Avalanche Method)
What it is: Direct all extra debt payments toward the highest-interest-rate debt first while making minimums on others.
Avalanche vs. Snowball — Interest Cost Comparison:
| Method | Total Interest Paid | Payoff Time | Best For |
|---|---|---|---|
| Avalanche (highest rate first) | Lower by ~15–20% | Shorter | Mathematical optimization |
| Snowball (lowest balance first) | Higher | Slightly longer | Behavioral motivation |
| Minimum payments only | Dramatically higher | Much longer | Not recommended |
A CFPB analysis found the avalanche method saves an average of $1,200–$2,500 in interest versus the snowball method for a typical multi-debt household, though the snowball method’s psychological wins produce higher completion rates in some populations.
🎯 Strategy 4: Build Emergency Fund Before Investing
What it is: Accumulate 3–6 months of living expenses in liquid savings before directing discretionary income toward investments.
The data: Federal Reserve research shows households with 3+ months of emergency savings are 78% less likely to take on high-interest debt during income disruptions [Federal Reserve Report on Economic Well-Being 2023]. The CFPB’s financial resilience research found that an emergency fund is the single strongest predictor of long-term financial stability — stronger than income level, education, or investment behavior. Households without emergency funds who encounter a $1,000 unexpected expense turn to credit cards 62% of the time at an average APR of 21.5%.
Key Personal Finance Patterns From The Data
1. Education Level vs. Net Worth Gap
The data across every Federal Reserve Survey of Consumer Finances wave since 1989 shows a consistent, widening gap in net worth by education. College graduates hold 5× the median net worth of workers with only a high school diploma. This gap has grown, not shrunk, over the past three decades — driven largely by asset price appreciation in homeownership and retirement accounts, both of which college graduates access at higher rates.
2. Income vs. Savings Rate Relationship
Higher income does not automatically produce higher savings rates in the short term due to lifestyle inflation — the tendency to increase spending proportionally with income. However, at incomes above $100,000, the structural savings rate typically rises because fixed costs (housing, food, transportation) represent a smaller share of income, leaving a larger discretionary margin. The data in Table 3 shows this clearly: the savings gap between the lowest and highest income brackets is structural, not behavioral alone.
3. Age vs. Debt Burden Patterns
Debt burden peaks in the 35–54 age range across nearly every debt category except student loans, which peak in the under-35 group. Mortgage debt drives most of the 35–54 burden. After 55, debt levels decline as mortgages are paid down, but credit card balances remain elevated into the early 60s — a pattern consistent with income declining before spending adjusts.
4. Geographic Differences in Savings
Savings behavior varies significantly by state. Households in the Northeast and Upper Midwest consistently show higher savings rates than the South and Mountain West in BLS Consumer Expenditure data, driven partly by income differences and partly by cost-of-living forcing more deliberate budgeting in high-cost areas. Hawaii, California, and New York households carry the highest absolute debt loads; Mississippi, Arkansas, and West Virginia households carry the lowest — but also the lowest savings balances.
5. Gender Differences in Financial Behavior
Women consistently report higher financial stress levels than men at equivalent income levels in APA survey data — a pattern attributed partly to the gender pay gap (women earn approximately $0.84 per dollar earned by men in 2024 [BLS]), partly to greater family financial management responsibility, and partly to longer life expectancy requiring more retirement capital. Women also demonstrate more consistent saving behavior when they do save, with lower account withdrawal rates in Vanguard 401(k) data during market downturns.
Frequently Asked Questions
1. What is the average American savings rate?
The U.S. personal savings rate as measured by the Bureau of Economic Analysis was approximately 3.6% in 2024 — near the lower end of its historical range. This compares to a long-run average of approximately 8–9% from the 1960s through the 1980s. The rate spiked to 33.8% in April 2020 during the COVID-19 pandemic due to stimulus payments and forced spending reduction, but has returned to pre-pandemic levels. A 3.6% savings rate means the average household retains less than $4 of every $100 earned after taxes.
2. How much should I have saved by age 30?
Fidelity Investments’ widely cited benchmark recommends having 1× your annual salary saved by age 30. For the median U.S. worker earning approximately $59,000, that implies $59,000 in retirement and savings accounts by 30. Federal Reserve data shows the median savings balance for Americans under 35 is approximately $5,400 — far below this benchmark. This gap is not necessarily irreversible: starting at 30 with $0 and saving 15% of a $60,000 salary with a 7% annual return produces approximately $500,000 by age 65.
3. What percentage of Americans live paycheck to paycheck?
Approximately 78% of American workers report living paycheck to paycheck as of 2024, according to LendingTree and PYMNTS survey data. This figure has remained between 70–80% for the past five years despite rising wages, reflecting persistent lifestyle inflation and the increasing cost of housing, healthcare, and food. Critically, 44% of six-figure earners report the same condition — indicating that paycheck-to-paycheck living is a spending pattern issue, not exclusively an income issue.
4. What is considered a good net worth by age?
The Federal Reserve Survey of Consumer Finances provides the benchmark data. Median net worth targets by age (2022 SCF): Under 35: ~$39,000 | Age 35–44: ~$135,600 | Age 45–54: ~$247,200 | Age 55–64: ~$364,500 | Age 65+: ~$409,900. These are medians — half of Americans fall below these figures. A more aspirational target based on Fidelity’s retirement readiness framework is to accumulate 10× final salary by retirement age, implying approximately $600,000–$800,000 for median-income workers.
5. How much credit card debt does the average American have?
The average credit card balance per cardholder was approximately $6,329 in 2024, according to Experian’s State of Credit report. Total U.S. credit card debt crossed $1.17 trillion for the first time in history in 2024. Approximately 48% of cardholders carry a balance from month to month — meaning they pay interest rather than paying in full. At the average APR of 21.5%, a $6,329 balance incurs approximately $1,361 in annual interest if only minimum payments are made.
6. What percentage of Americans have no retirement savings?
Approximately 28% of Americans have no retirement savings of any kind, according to the Federal Reserve Survey of Consumer Finances 2022. Among workers aged 55–64 — within 10 years of typical retirement age — approximately 22% have zero dedicated retirement savings. Social Security benefits average $1,907 per month in 2024, which provides approximately 40% income replacement for average earners — well below the 70–80% typically recommended for maintaining pre-retirement living standards.
Key Terms Glossary
Personal Savings Rate
The percentage of disposable personal income that households retain rather than spend, as measured by the Bureau of Economic Analysis. A rate of 5% means $5 is saved for every $100 of after-tax income received.
Net Worth
Total assets minus total liabilities. Assets include savings, investments, home equity, and retirement accounts; liabilities include mortgages, credit cards, student loans, and auto loans. Net worth is the most comprehensive single measure of financial health.
Liquid Assets
Assets that can be converted to cash quickly without significant loss of value — primarily cash, checking accounts, savings accounts, and money market funds. Retirement accounts and home equity are not considered liquid assets.
Emergency Fund
A dedicated pool of liquid savings typically equal to 3–6 months of living expenses, held separately from investment accounts. Its function is to absorb financial shocks without requiring high-interest borrowing.
Debt-to-Income Ratio (DTI)
Total monthly debt payments divided by gross monthly income, expressed as a percentage. Lenders typically require a DTI below 43% for mortgage qualification. A DTI above 50% is generally considered financially stressed.
Credit Utilization
The percentage of available revolving credit currently being used. Calculated as total credit card balances divided by total credit limits. Credit scoring models generally reward utilization below 30%; below 10% produces optimal scoring effects.
Compound Interest
Interest calculated on both the principal and accumulated interest from prior periods. The formula A = P(1 + r/n)^(nt) shows how even small rate differences produce large long-term wealth differences. See the compound interest statistics page for full data.
401(k)
An employer-sponsored defined contribution retirement plan allowing pre-tax (traditional) or post-tax (Roth) contributions up to $23,000 per year in 2024 ($30,500 for those 50+). Employer matching contributions are effectively a 100% return on matched dollars.
Financial Stress Index
A composite measure used in research surveys to quantify the psychological and behavioral impact of financial pressure. Components typically include worry frequency, sleep disruption, relationship conflict, and avoidance behaviors related to money.
Consumer Expenditure (CE)
The Bureau of Labor Statistics’ measurement of household spending across all categories, collected via quarterly interviews and weekly diaries. The CE Survey is the primary data source for understanding how Americans allocate spending across necessities and discretionary items.
📖 Statistical Concepts Used On This Page
Median vs. Mean: Net worth and savings data use median values as the primary measure because the distribution of wealth is strongly right-skewed — a small number of very wealthy households pull the arithmetic mean far above the typical experience. The mean vs. median page explains when each measure is appropriate and how skewness affects interpretation.
Percentage Change: Savings rates and debt growth figures throughout this page use percentage change calculations. The descriptive statistics page covers how to calculate and interpret percentage change in financial data correctly.
Survey Sampling: The Federal Reserve Survey of Consumer Finances uses a stratified random sample with deliberate oversampling of high-wealth households to produce nationally representative estimates. The sampling distributions page explains why this design is necessary and how survey-based statistics should be interpreted.
Index Numbers: CPI inflation data used to calculate real savings rates and real wage growth relies on index number methodology. The normal distribution page covers how price index construction affects the interpretation of real versus nominal figures.
Further Reading & Data Sources
Bureau of Economic Analysis (BEA)
Personal savings rate data, disposable income, and consumer spending at bea.gov. The Personal Income and Outlays release is published monthly and is the primary source for U.S. savings rate figures.
Federal Reserve Survey of Consumer Finances
Conducted every three years, the SCF provides the most comprehensive data on U.S. household wealth, debt, savings, and retirement accounts. Available at federalreserve.gov. The 2022 wave is the most recent publicly available dataset.
Federal Reserve Bank of New York — Household Debt and Credit Report
Quarterly report tracking total U.S. household debt by category, delinquency rates, and credit conditions at newyorkfed.org. Updated quarterly with a 60-day lag.
Bureau of Labor Statistics — Consumer Expenditure Survey
Annual survey of how American households allocate spending across all categories. Available at bls.gov/cex. The primary source for Table 13 spending data on this page.
Fidelity Investments — Retirement Savings Assessment
Annual analysis of 401(k) and IRA balances by age group, savings rates, and retirement readiness benchmarks at fidelity.com. Covers over 45 million Fidelity accounts.
Vanguard — How America Saves
Annual report analyzing 401(k) behavior across Vanguard-administered plans covering approximately 5 million participants. Covers contribution rates, asset allocation, and behavioral patterns at vanguard.com/how-america-saves.
Data on this page reflects the most recently available figures from primary sources as of 2025. Statistics subject to revision as new survey waves and government reports are released.